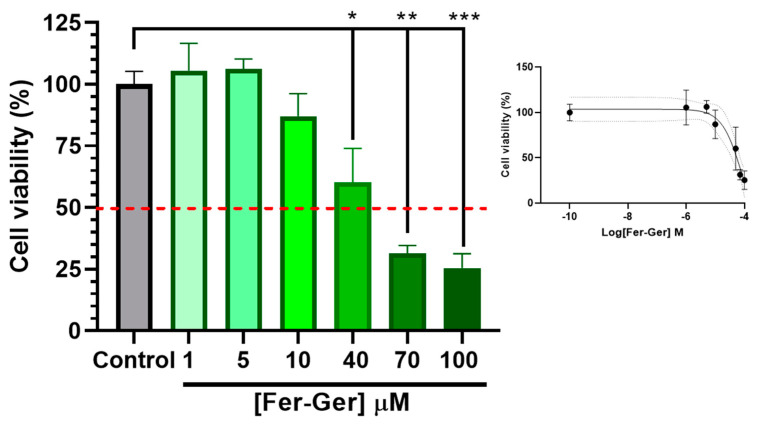
Figure 6.
Effect of different concentrations of Fer-Ger on the viability of neuronally differentiated N2a cells. Red line highlights 50% of cell viability (IC50; see the insert). The insertion of the figure reports the sigmoidal plot for IC50 calculations. * p < 0.05, ** p < 0.001 and *** p < 0.0001, mean significant differences compared with the control cells using one-way ANOVA, followed by Dunnett’s multiple comparisons test.

