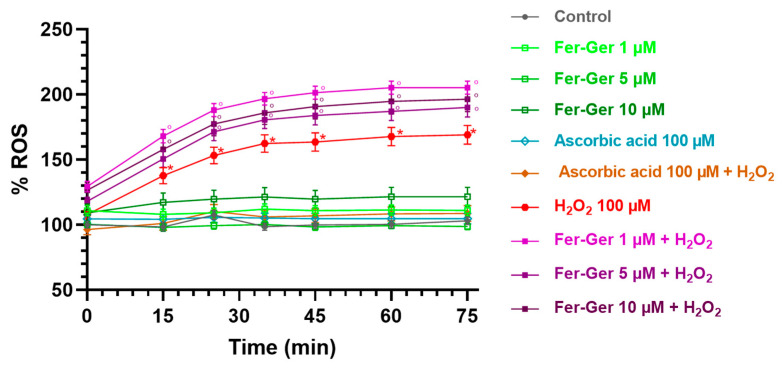
Figure 9.
ROS production in differentiated N2a cells exposed to oxidative stress by H2O2 (100 µM) and treatments with Fer-Ger (1, 5, and 10 µM) or ascorbic acid (100 µM). Data are reported as percentages over control cells, and the assay was carried out for 75 min in order to measure the time-course of intracellular ROS production. Data are expressed as mean ± S.E.M. (n = 6). * p < 0.05: H2O2-treated cells compared to the control (untreated cells); ° p < 0.05: 1, 5, or 10 µM Fer-Ger-exposed cells in the presence of H2O2 compared to the control (untreated cells).

