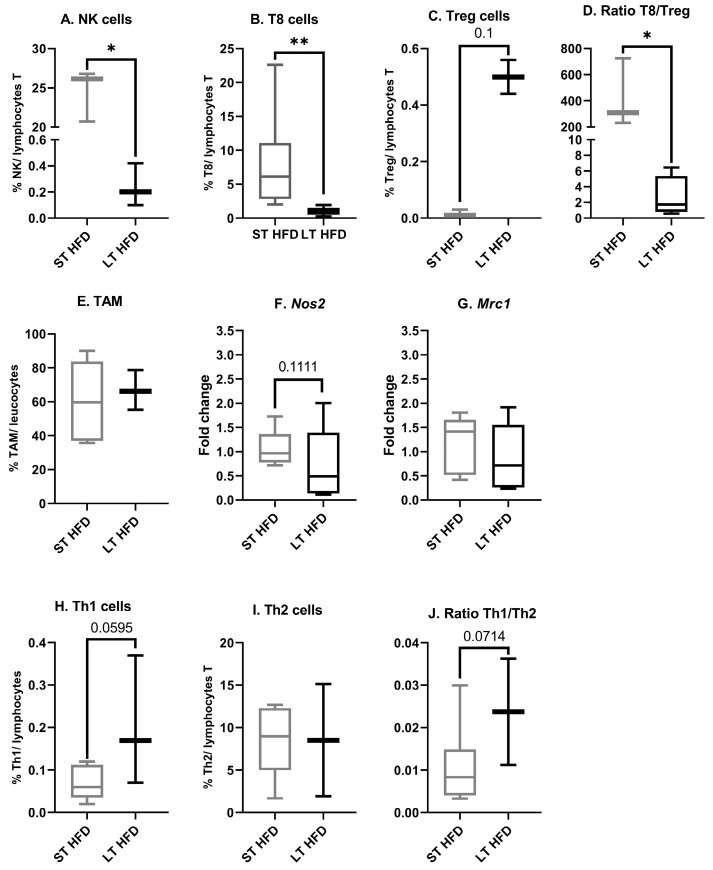
Figure 7.
Tumour microenvironnement immune infiltration. (A–E,H–J) Sub-populations of immune cells were quantified by flow cytometry using marked antibodies against specific cell surface markers. (F,G) mRNA expression of Nos2, a specific marker of M1, and Mrc1, a specific marker of M2, were explored using RT-qPCR and normalised with Cd45. Flow cytometry was performed on 10–13 mice/group and mRNA expression analysis on 5 mice/group. Results are presented as boxes with median, interquartile range and min–max values. Data were analysed by a Mann–Whitney test, * p < 0.05, ** p < 0.01. ST and LT HFD: short- or long-term high-fat diet.

