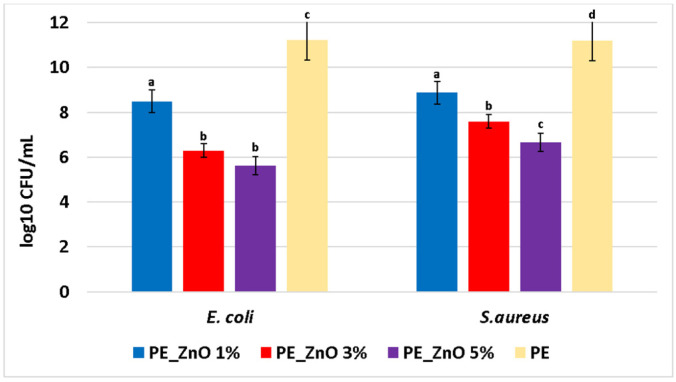
Figure 13.
Graphical representation of log10 CFU/mL values obtained for the tested E.coli and S. aureus, expressing biofilm embedded cells developed on PE_ZnO 1%, PE_ZnO 3%, PE_ZnO 5%, and control (PE) composite films after 24 h incubation. Different small letters indicate statistically significant differences between films (p < 0.05).

