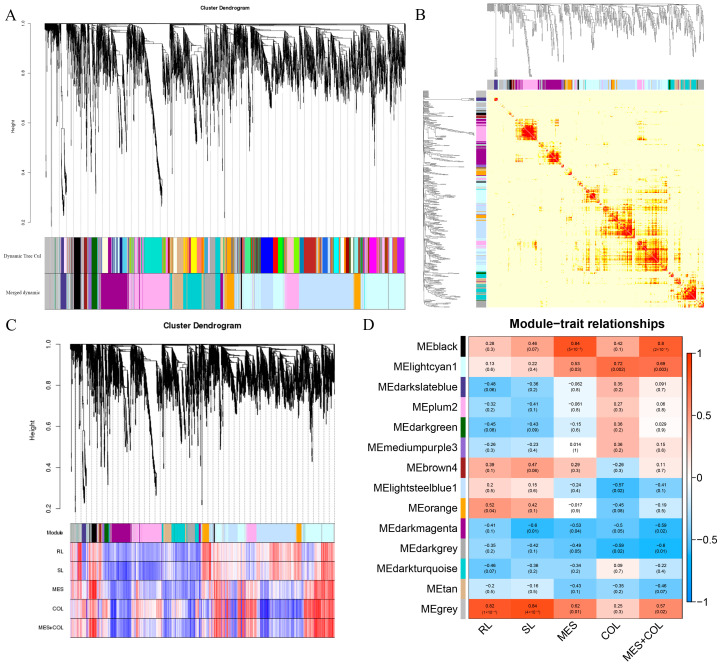
Figure 8.
Module construction based on WGCNA. (A) Gene network module. (B) Gene co-expression network heat map. (C) Gene phylogenetic tree and trait correlation heat map. (D) Heatmap of correlation between modules and traits. The closer the correlation is to the absolute value of 1, the more relevant the trait is to the gene of the module.

