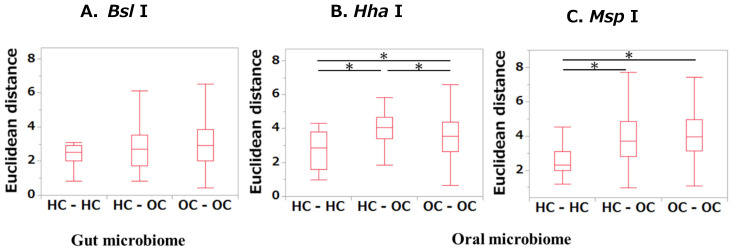
Figure 2.
Interparticipant variability among the HC and OSCC groups according to Euclidean distance analyses. For microbiome samples, Euclidean distance was employed to calculate the distance for each sample. Variability between HCs, among OSCCs, and between HCs and OSCC patients was assessed. Comparisons among multiple groups were analyzed using the Kruskal–Wallis test, followed by Steel–Dwass multiple comparison tests. * p < 0.05 (statistically significant).

