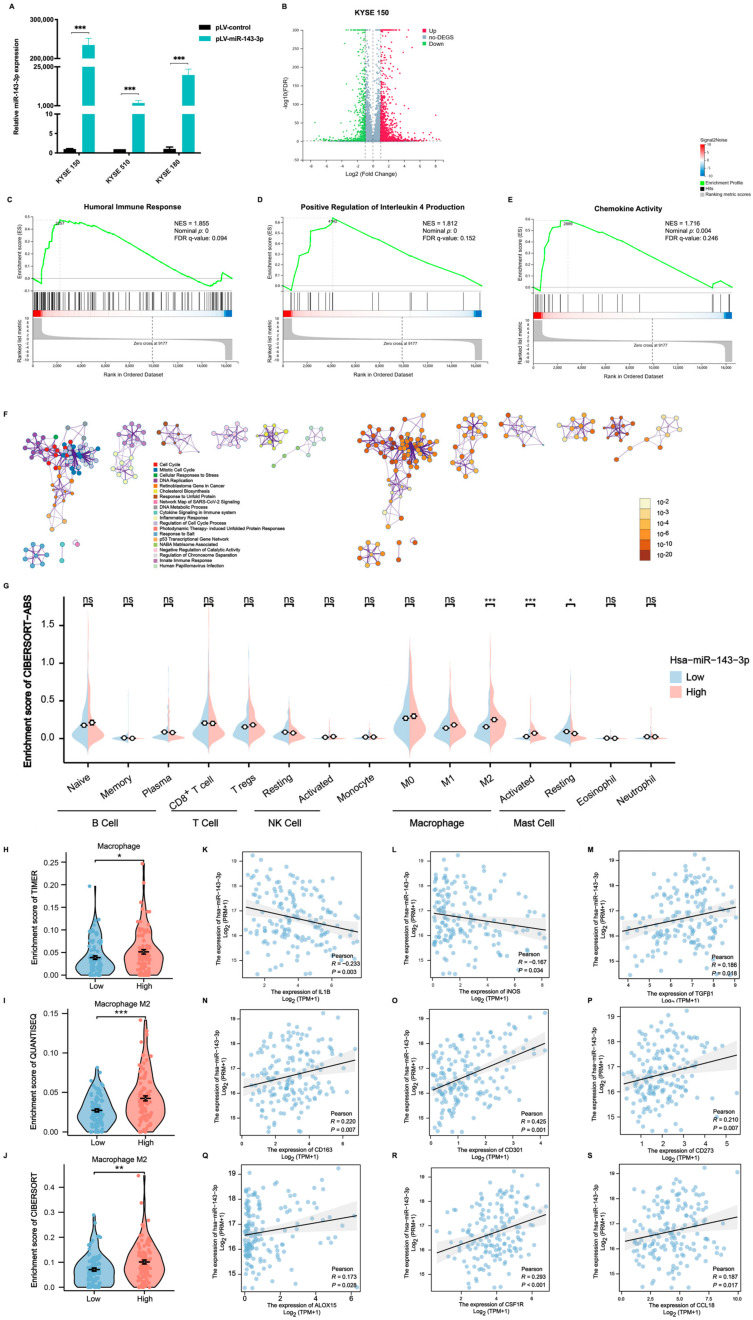
Figure 3.
MiR-143-3p is involved in the ESCC immune microenvironment. (A) qRT-PCR analysis of the miR-143-3p levels in pLV-miR-143-3p- and pLV-control-transfected KYSE150, KYSE510, and KYSE180 cells. (B) Volcano plot showing the differential genes between the pLV-miR-143-3p and pLV-control-transfected KYSE150 cells. (C–E) Gene set enrichment analysis (GSEA) revealing the activated immune response induced by activation of the humoral immune response (C), positive regulation of interleukin 4 production (D), and chemokine activity (E) in pLV-miR-143-3p-tranfected KYSE150 cells. (F) The Metascape enrichment analysis results for differentially expressed genes across pLV-miR-143-3p and pLV-control-transfected KYSE150 cells. (G) Boxplot demonstrating the infiltration levels of immune cells in the high-miR-143-3p and low-miR-143-3p groups using the CIBERSORT-ABS algorithm. (H–J) Boxplot exhibiting the infiltration levels of macrophages in the high-miR-143-3p and low-miR-143-3p groups using TIMER (H), QUANTISEQ (I), and CIBERSORT (J) algorithms. (K–M) Pearson correlation analysis of expression levels between miR-143-3p and M1 macrophage markers (IL1B and iNOS) based on TCGA data. (N–S) Pearson correlation analyses of the expression levels between miR-143-3p and M2 macrophage markers (TGFB1, CD163, CD301, CD273, ALOX15, CSF1R, and CCL18) based on TCGA data. Abbreviations: ESCC, esophageal squamous cell carcinoma; qRT-PCR, quantitative real-time reverse-transcription PCR; TGCA, The Cancer Genome Atlas; ns, not significant; TPM, Transcripts Per Kilobase Million. (***: p < 0.001, **: p < 0.01, *: p < 0.05, ns: not significant).

