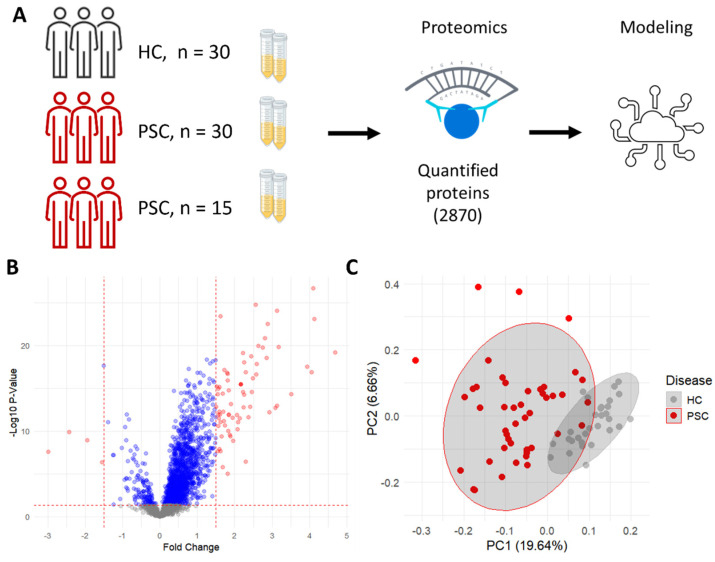
Figure 1.
Proteomic profiling demonstrates unique protein expression in PSC patients. (A) In the data acquisition process, serum was taken from three cohorts of individuals, quantified by the real-time PCR-based proximity extension assay (PEA) and used to model disease presence. (B) Volcano plot showing the fold change (red points represent FC > 1.5, blue points represent FC < 1.5) and −Log10 of the p-value from a Welch two-sample t-test between HC and PSC patients. (C) Principal component analysis showing the separation of HC and PSC patients.

