Figure 1.
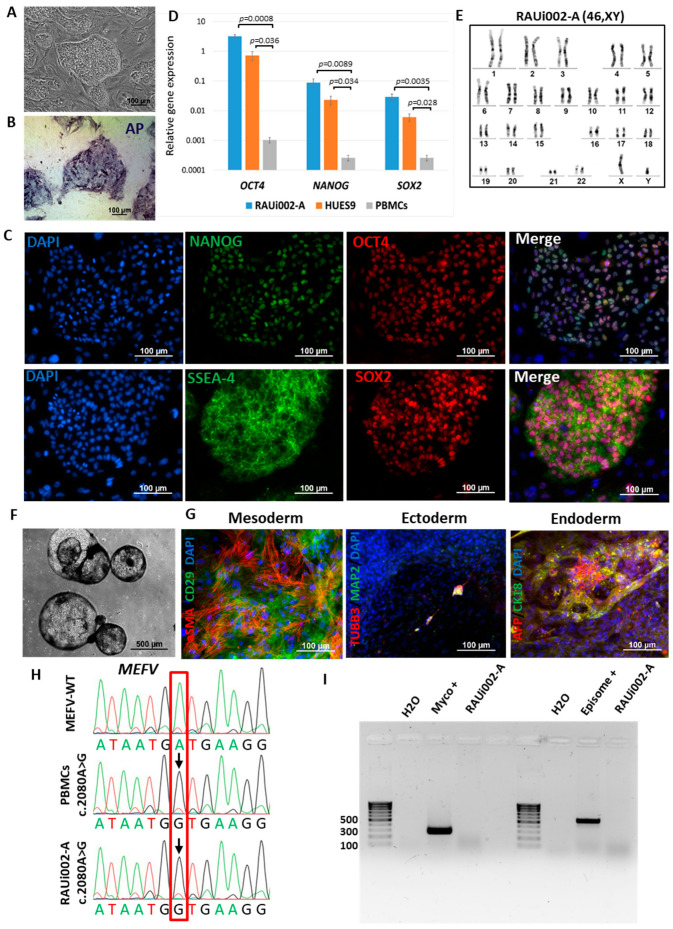
Characteristics of the iPSC cell line RAUi002-A. (A) Morphology of iPSC colonies. (B) Histochemical detection of alkaline phosphatase (AP). (C) Immunofluorescent staining for pluripotency markers OCT4 (red signal), NANOG (green signal), SSEA-4 (green signal), TRA-1-60 (red signal). (D) Quantitative analysis of the expression of pluripotency markers (OCT4, NANOG, SOX2) using RT-qPCR. Error bars indicate the standard deviation, p-value < 0.05, n = 3. Student’s t-test was used to assess statistical significance. (E) Karyotype analysis confirmed the presence of normal (46,XY) chromosome set. (F) Morphology of embryoid bodies on the 18th day of differentiation. (G) Immunofluorescent staining for differentiation markers: αSMA (red signal) and CD29 (green signal) (mesoderm); TUBB3/TUJ1 (red signal) and MAP2 (green signal) (ectoderm); AFP (red signal) and CK18 (green signal) (endoderm). Nuclei were stained with DAPI (blue signal). (H) Chromatograms of MEFV gene regions of PBMCs of a patient with FMF, and iPSCs with wild-type MEFV [26]. The position of the detected polymorphism indicated with red box. The detected polymorphism is marked with arrow. (I) PCR test for mycoplasma and episomes of the iPSC line (RAUi002-A). Scale bars for (A–C) and (G)—100 μm. Scale bar for (F)—500 μm.

