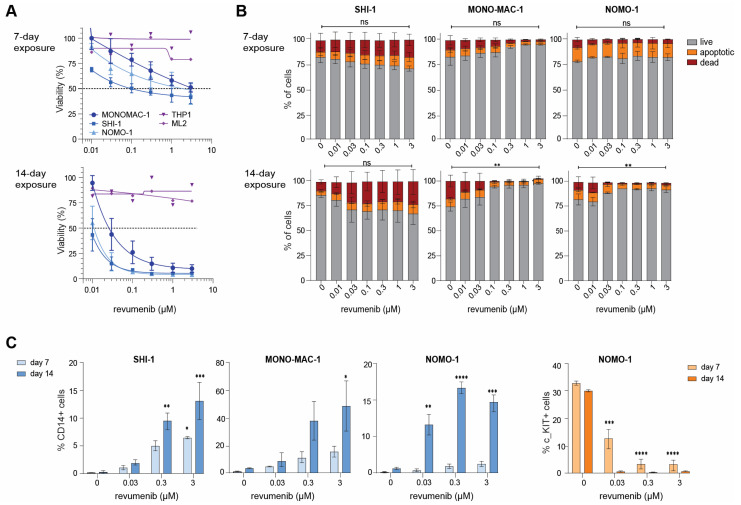
Figure 2.
Prolonged revumenib exposure induces myeloid differentiation in KMT2A-rearranged AML cells. (A) Percentage of viable cells after 7 and 14-day exposures to indicated concentrations of revumenib as determined by trypan blue exclusion in KMT2A-rearranged AML cell line models (n = 5). Responsive cell lines are in blue and unresponsive cell lines are in purple. The dashed line shows the 50% viability threshold. Experiments were performed in technical duplicates and data consisted of two biological replicates. (B) Percentages of live (grey), apoptotic (orange), and dead (red) cells after 7 and 14-day exposures to indicated concentrations of revumenib as determined by an Annexin V/7AAD staining and flowcytometry in KMT2A-rearranged AML cell line models. Differences in live, apoptotic, and death cells induced by revumenib as compared to untreated controls were statistically verified by two-way ANOVA Tukey’s multiple comparisons tests. Data consisted of two biological replicates. (C) Flow cytometric assessment of the expression of the myeloid differentiation marker CD14 and of stem cell marker CD117 (c-Kit) after 7 and 14 days of revumenib exposure in the responsive KMT2A-rearranged AML cell lines SHI-1, MONO-MAC-1, and NOMO-1, from duplicate experiments. * p < 0.05, ** p < 0.005, *** p < 0.0005, **** p < 0.00005 and ns for no significant p.

