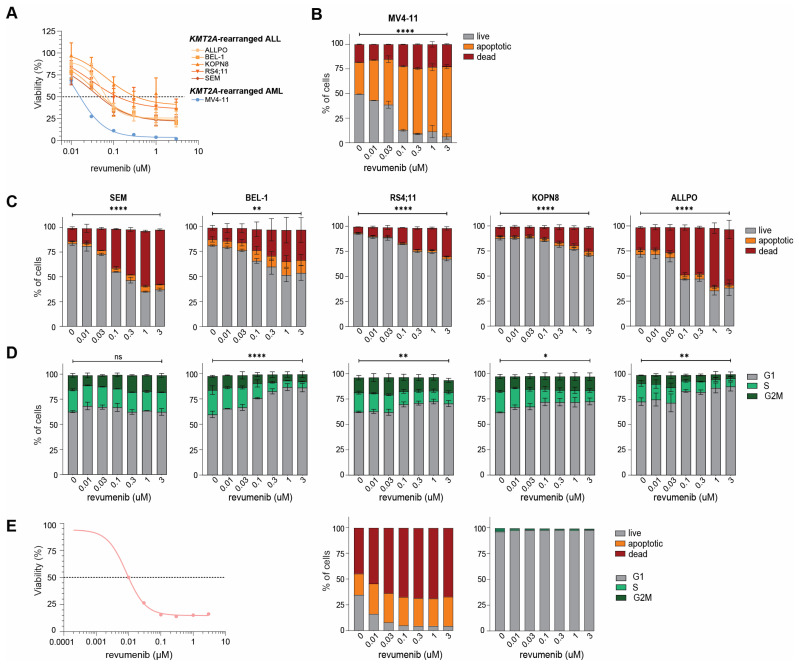
Figure 3.
Revumenib readily induces apoptosis in KMT2A-rearranged ALL cells. (A) Percentage of viable cells after 4-day exposures to indicated concentrations of revumenib as determined by trypan blue exclusion in KMT2A-rearranged ALL cell line models (n = 5; in orange) and the highly sensitive KMT2A-rearranged AML cell line MV4-11 (in blue). The dashed line shows the 50% viability threshold. Experiments were performed in technical duplicates and data consisted of two biological replicates. (B) Percentages of live (grey), apoptotic (orange), and dead (red) cells after 4-day exposures to indicated concentrations of revumenib as determined by flow cytometry and Annexin V/7AAD staining in the KMT2A-rearranged AML cell line MV4-11 and (C) in the KMT2A-rearranged ALL cell lines. Differences in live, apoptotic, and death cells induced by revumenib as compared to untreated controls were statistically verified by two-way ANOVA Tukey’s multiple comparisons tests. Data consisted of two biological replicates. (D) Cell cycle analysis showing the percentages of cells residing in the G1-phase, S-phase, and GM2-phase as determined by Hoechst 33342/7AAD staining and flow cytometry after 4-day exposures to indicated concentrations of revumenib. Differences in cell cycle phases induced by revumenib as compared to untreated controls were statistically verified by two-way ANOVA Tukey’s multiple comparisons tests. Data consisted of two biological replicates. (E) Cell viability (as determined by trypan blue exclusion) and cell cycle analysis (as determined by Hoechst 33342/7AAD staining and flow cytometry) after 4-day exposures to indicated concentrations of revumenib in a representative KMT2A-rearranged infant ALL patient sample obtained from a patient-derived xenograft mouse model. The dashed line shows the 50% viability threshold. * p < 0.05, ** p < 0.005, **** p < 0.00005 and ns for no significant p.

