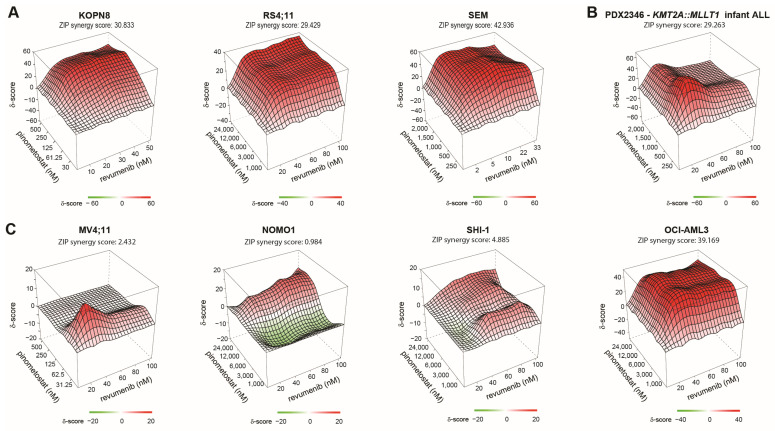
Figure 5.
Synergy between revumenib and pinometostat in KMT2A-rearranged ALL. Three-dimensional synergy plots showing drug synergy (red) or antagonism (green) between indicated concentrations of revumenib (x-axis) and pinometostat (y-axis) as determined by 6-day pinometostat pre-treated cells followed by 4-day MTT assays of revumenib exposures in (A) KMT2A-rearranged ALL cell lines, (B) a PDX derived KMT2A-rearranged infant ALL patient sample, and (C) KMT2A-rearranged AML cell lines. Drug synergy/antagonism is expressed as Zero Interaction Potency (ZIP) scores (z-axis), with scores of >5 being considered as synergistic effects (red areas), and ZIP scores below −5 are deemed as antagonistic effects (green areas). On top of each 3D synergy plot, the average ZIP score over the entire range of pinometostat and revumenib concentrations is listed.

