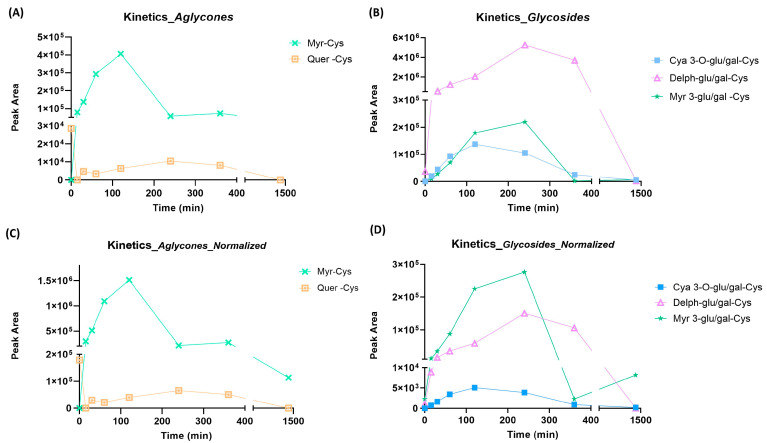
Figure 4.
Peak area values as a function of time for the aglycones present in BPE (left panels, A,C) and the glycosidic forms (right panels, B,D); (panels C,D) correspond to normalized trends. Normalization considers the relative abundance of each ion; more specifically, the AUC was divided for the relative abundance.

