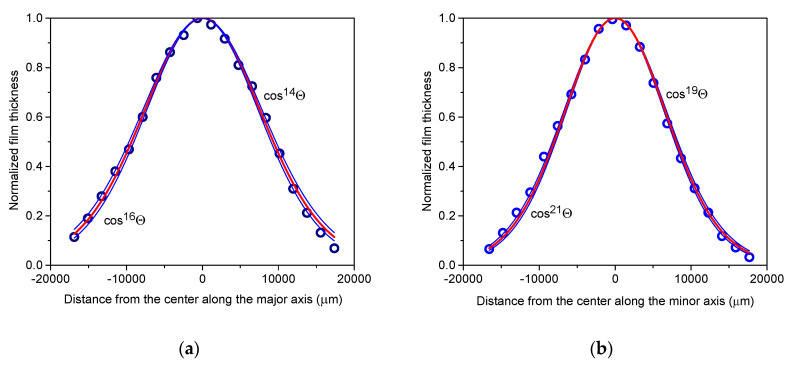
Figure 6.
Thickness distributions along the major axis (a) and minor axis (b) of the copper film deposited using 600 fs pulses of 4.18 ± 0.19 mJ energy focused to a 0.085 mm2 spot area. The distribution can be effectively fitted by the single cosine terms cos15±1Θ and cos20±1Θ (blue lines) for the major and minor axes, respectively. Red lines represent the mean fits.

