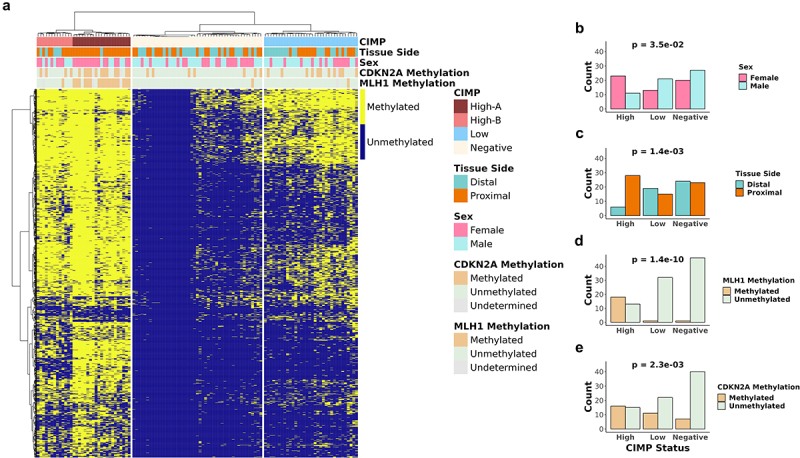
Figure 1.

Categorical analysis of hierarchical clustering of methylation data CIMP status of CRC patient tumor samples.
(a) Unsupervised hierarchical clustering of 115 CRC tumor samples based on 1317 CpG sites from DREAM methylation data. b-e) Bar plots showing the patient statistics (b) sex, (c) tissue side, (d) MLH1 methylation status, and (e) CDKN2A methylation status in each CIMP status. Fisher’s exact test was used to test for statistical significance for each comparison in b-e.
