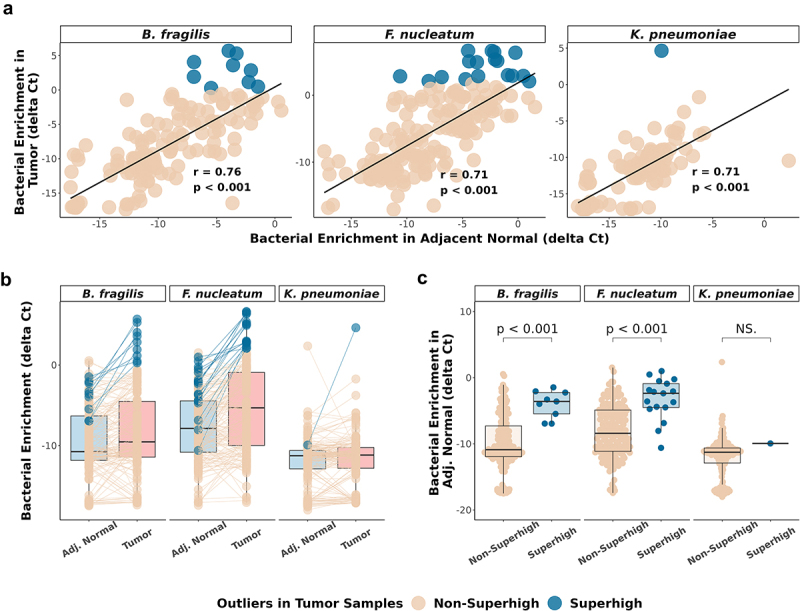
Figure 3.

Bacterial enrichment in CRC adjacent normal is associated with CIMP.
(a) Scatterplot showing the enrichment of 115 paired tumor samples (y-axis) and adjacent normal samples (x-axis) by qPCR in B. fragilis, F. nucleatum, and K. pneumoniae. Linear regression lines (black) are built on each correlation. Pearson correlation coefficients and p-values are indicated in each plot. (b) Comparison of the delta Ct values between 115 paired adjacent normal and the tumor samples by bacterial qPCR. Blue and cream lines connect each paired adjacent normal and tumor samples. Blue dots represent bacterial Superhigh cases determined by high bacterial enrichment in tumor samples across the three bacterial species. (c) Comparison of the Superhigh and the Non-Superhigh cases determined by tumor samples in adjacent normal samples. Significance was calculated by Wilcoxon test.
