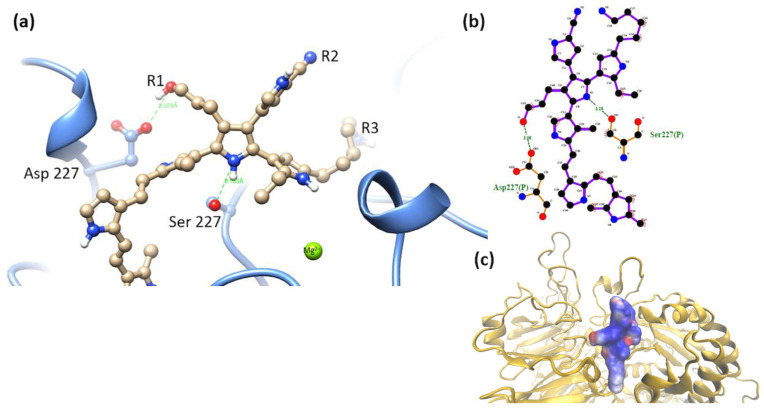
Figure 16.
(a) MIDAS interaction of the α5β1 cluster-model 3 [28], the interaction of Asp 227 with PSPy model elements. Figures made with UCSF Chimera 1.15 software [26]. (b) A 2D interaction map made with LigPlot+ Version 2.2.4 software [38]. Hydrogen bonds are highlighted in green dotted lines. (c) Electrostatic potential of the PSPy model 3 in the binding site of the α5β1 integrin domain [28], where positive (blue color) and negative charges (red color) are shown. In minor proportion non-polar contacts are shown in white color. These figures were made in VMD Version 1.9.4a53 software [42].

