
Figure 7.
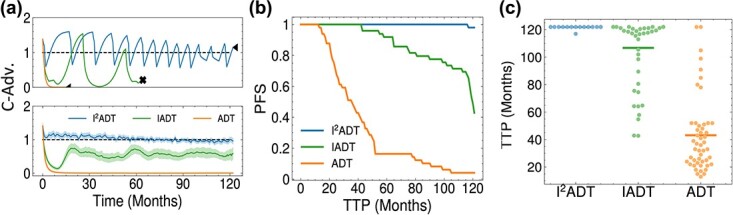
The figure presents the comparison among I ADT, IADT and ADT for the response
group. (A) The dynamics of the competition advantage of responsive
cancer cells toward the resistant cancer cells in patient106 (upper panel), and all
responsive patients with 95% CI (lower panel). (B) The PFS rate over
time with I
ADT, IADT and ADT for the response
group. (A) The dynamics of the competition advantage of responsive
cancer cells toward the resistant cancer cells in patient106 (upper panel), and all
responsive patients with 95% CI (lower panel). (B) The PFS rate over
time with I ADT, IADT and ADT.
(C) The distribution of TTP with I
ADT, IADT and ADT.
(C) The distribution of TTP with I ADT, IADT and ADT.