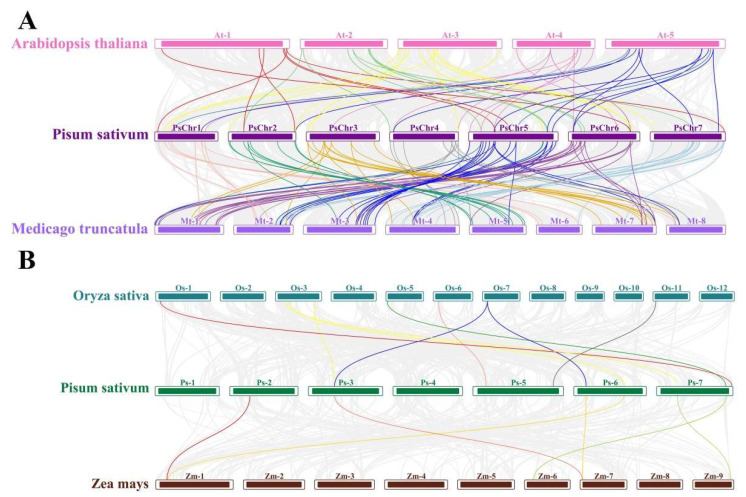
Figure 5.
Collinearity analysis of the PHD finger family genes in pea. (A) Collinearity analysis of pea with A. thaliana and M. truncatula. (B) Collinearity analysis of pea with rice and maize. Gray lines in the background indicate collinear blocks in the pea and other species’ genomes. Boxes of different colors represent chromosomes of the species, while lines of different colors show gene pairs homologous to the pea PHD finger genes.

