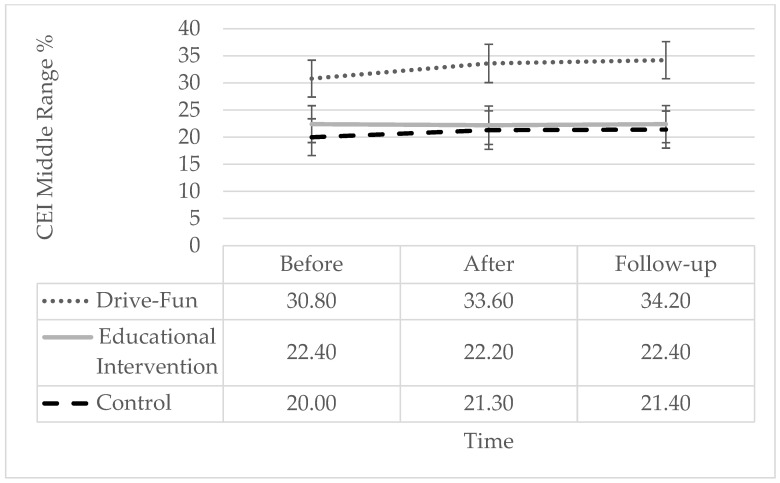
Figure 5.
CEI middle-range score by study groups and time. The error bars represent the standard error. Simple effect analysis shows a significant reduction after the intervention (p = 0.002) and at follow-up (p < 0.001), compared to before the intervention, only among the Drive-Fun group. There are no other significant differences (p < 0.05).

