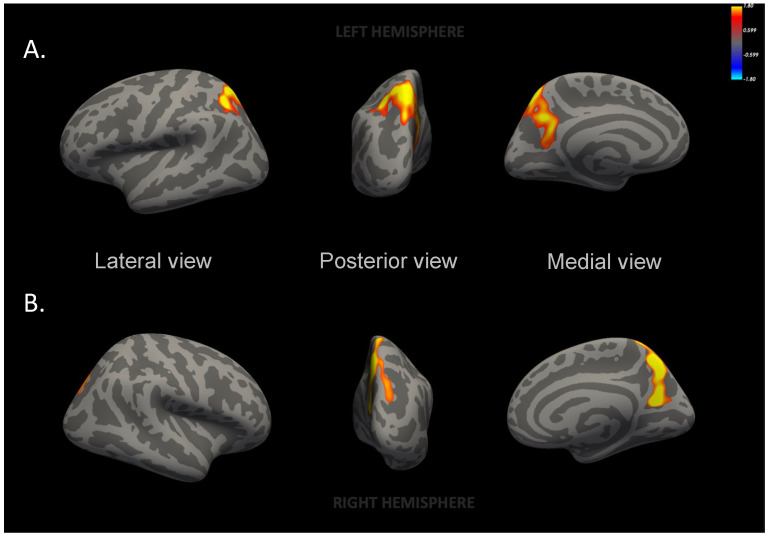
Figure 2.
Inflated maps of cortical surface area differences between Mediterranean diet and usual care groups. (A) Left superior parietal area, p = 0.03; (B) right precuneus area, p < 0.001. Maternal brain surface in lateral, posterior and medial views. Images generated from a general linear model with total intracranial volume, age, magnetic resonance protocol and nulliparity. The color bar indicates logarithmic scale of p values (−log10). Red to yellow color reflects the increased surface area in the Mediterranean diet group participants as compared to usual care group participants.

