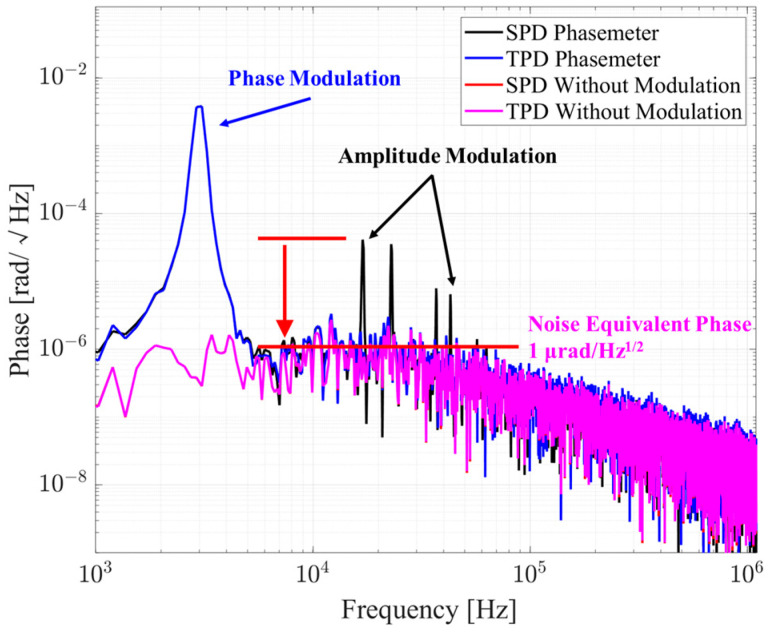
Figure 7.
Comparison of the amplitude spectrum density. The black and blue lines stand for the results of the SPD and TPD phasemeters with phase modulation, amplitude modulation, and additive noise. The red and pink lines stand for the results of the SPD and TPD phasemeters with only additive noise, and they basically coincide. Peaks on the black curve between 10 kHz and 100 kHz come from the sum-frequency and difference-frequency of the phase and amplitude modulation frequencies. These peaks introduced by amplitude modulation are effectively suppressed to the noise floor by the TPD phasemeter.

