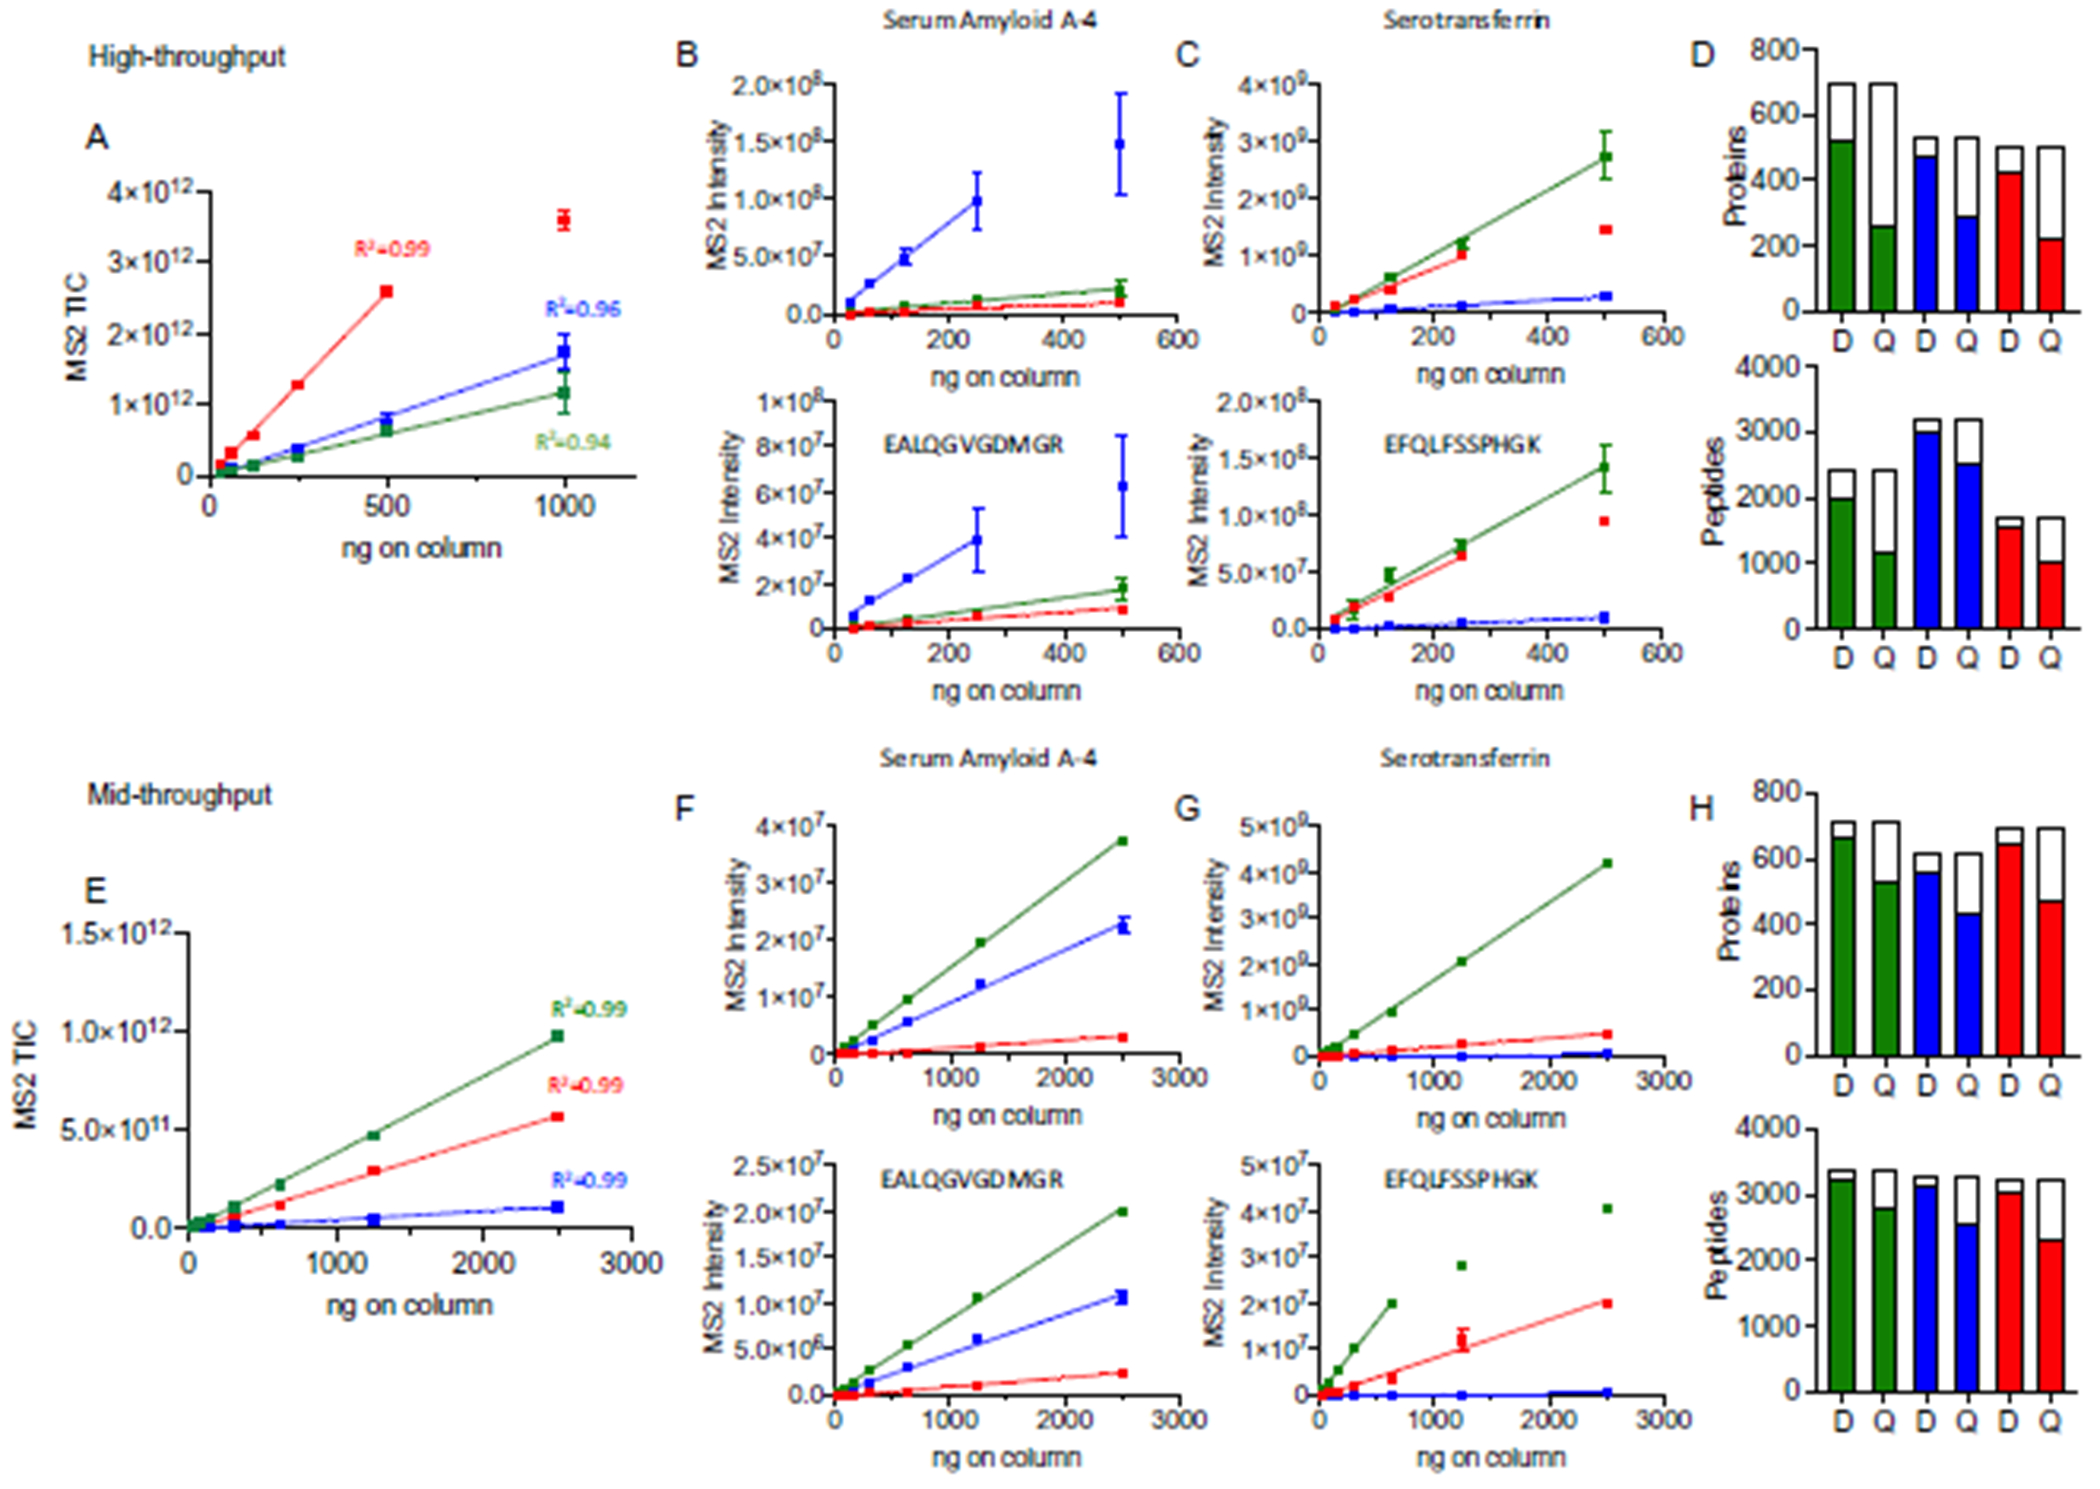
Fig. 3. Comparison of linearity across biofluids and throughputs.

Assessment of total MS2 signal intensity across increasing column load for naive plasma (green), depleted plasma (blue), and dried blood (red) using the (A) high- and (E) mid-throughput workflow. The range of linear response is shown for selected proteins, serum amyloid A-4 (B and F) and serotransferrin (C and G), and representative peptides. Panels (D) and (H) show a summary of the proteins and peptides with an observed LLOD or LLOQ in both throughput methods. Total column height indicates the number of proteins or peptides with 2 or more observations in at least one loading condition. The filled columns indicate the number of proteins or peptides where an LLOD or LLOQ (designated as D or Q) was determined. See Methods for a description of LLOD/Q determination.
