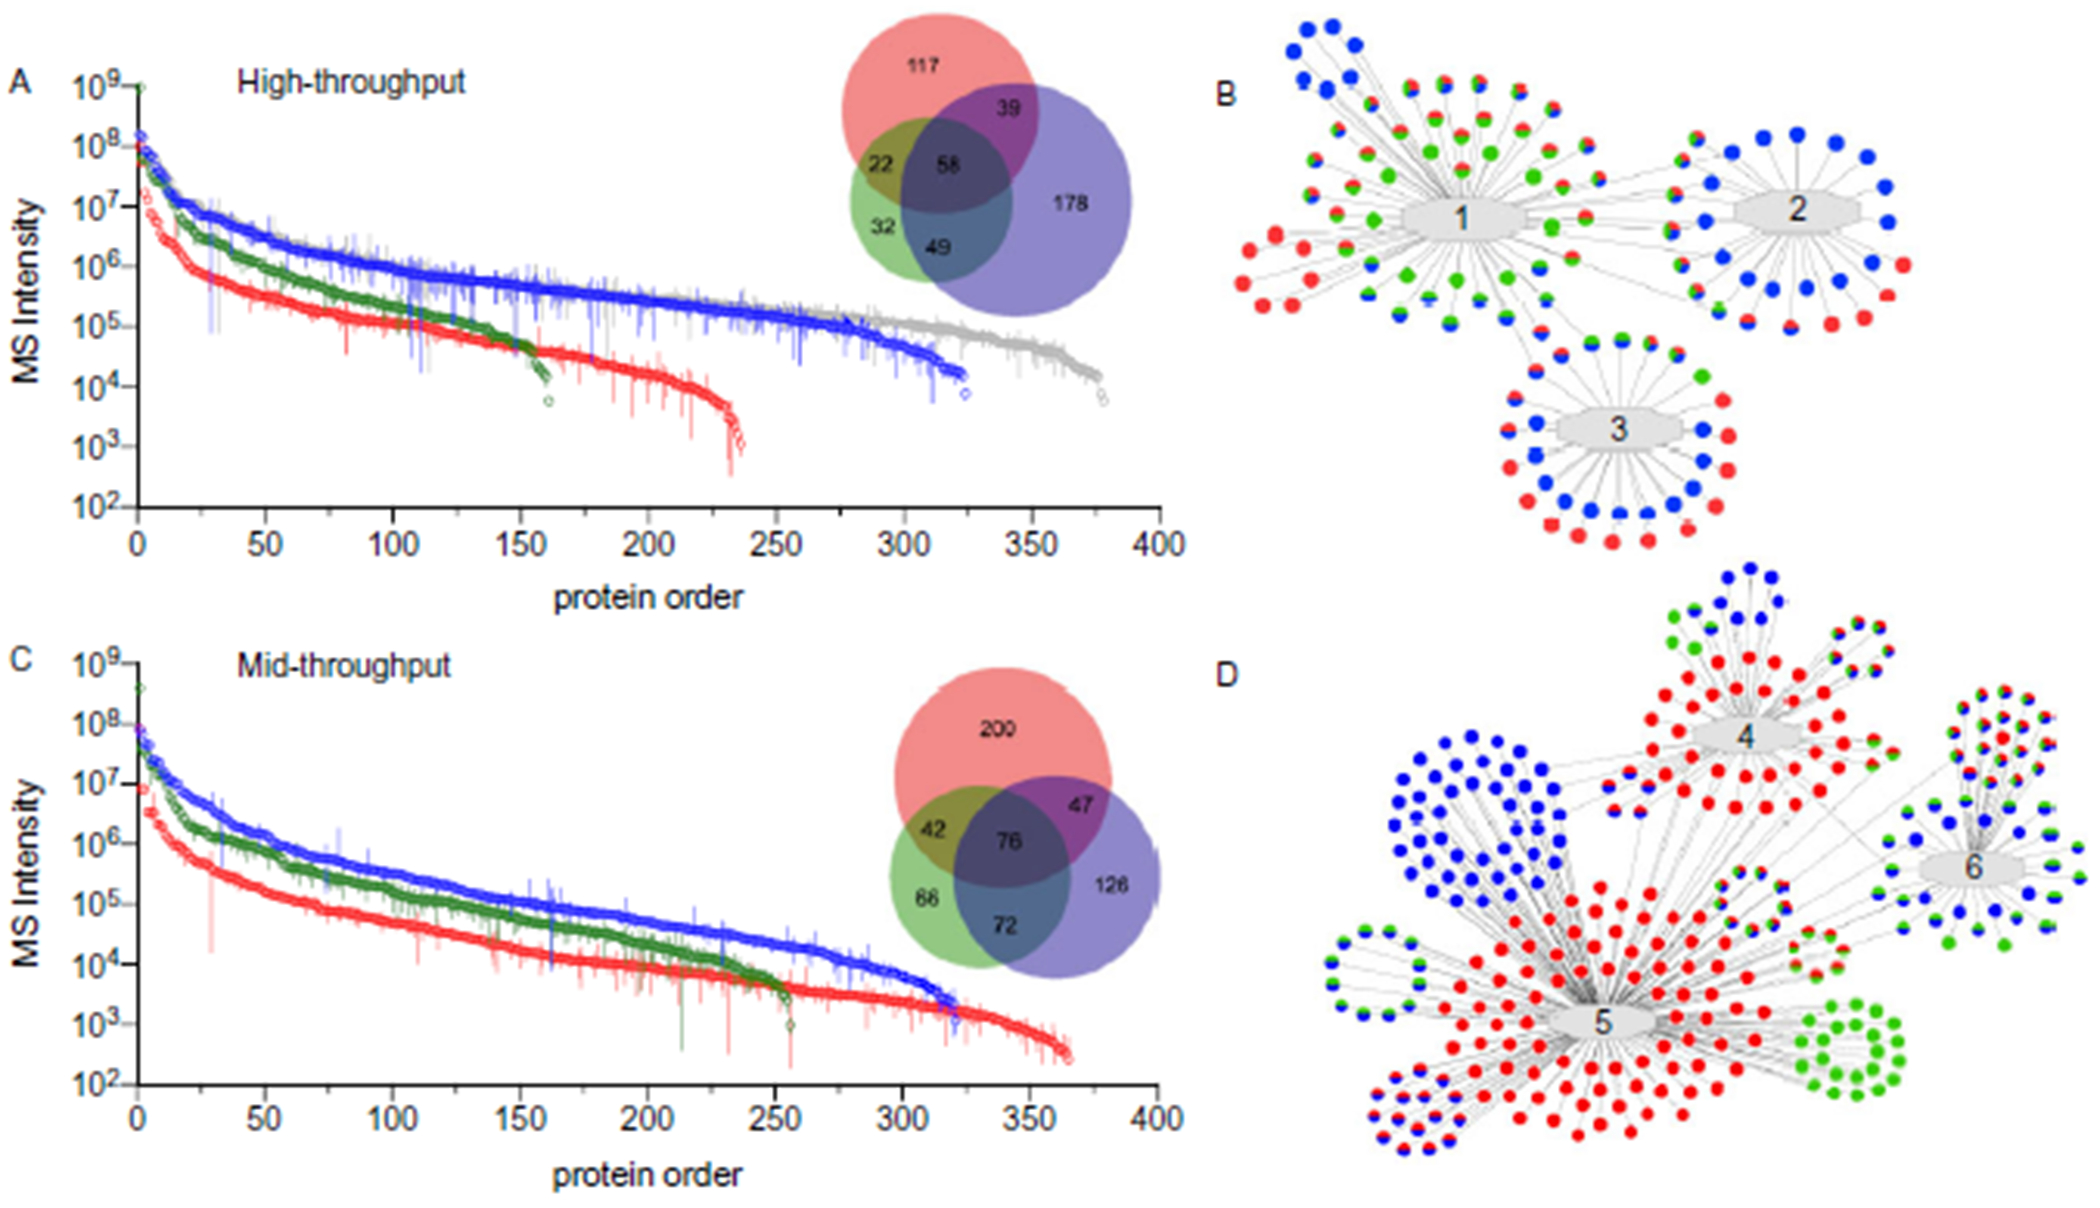
Fig. 5. Comparisons of reliable proteomes in standardized workflows.

Reliable protein observations are shown for naive plasma (green), depleted plasma (blue) and dried blood (red) in the high- (A) and mid-throughput (C) workflows. Proteins were ordered based on the multi-day mean intensity (error bars = SD). Venn diagrams match the stated color scheme. For comparison, proteins identified for naive and depleted plasma were combined (grey) indicating proteome coverage achieved by independent analysis of both biofluids. Representative examples of network analysis are shown for the high- (B) and mid- (D) throughputs. Networks: 1, adaptive immune response; 2, ERK1 and ERK2 cascade; 3, mitochondrial matrix;4, oxidoreductase activity; 5, intracellular non-membrane–bound organelles; 6, complement and coagulation cascade. Dots indicate identified proteins (colors match panels A and C). Gene names were omitted for space.
