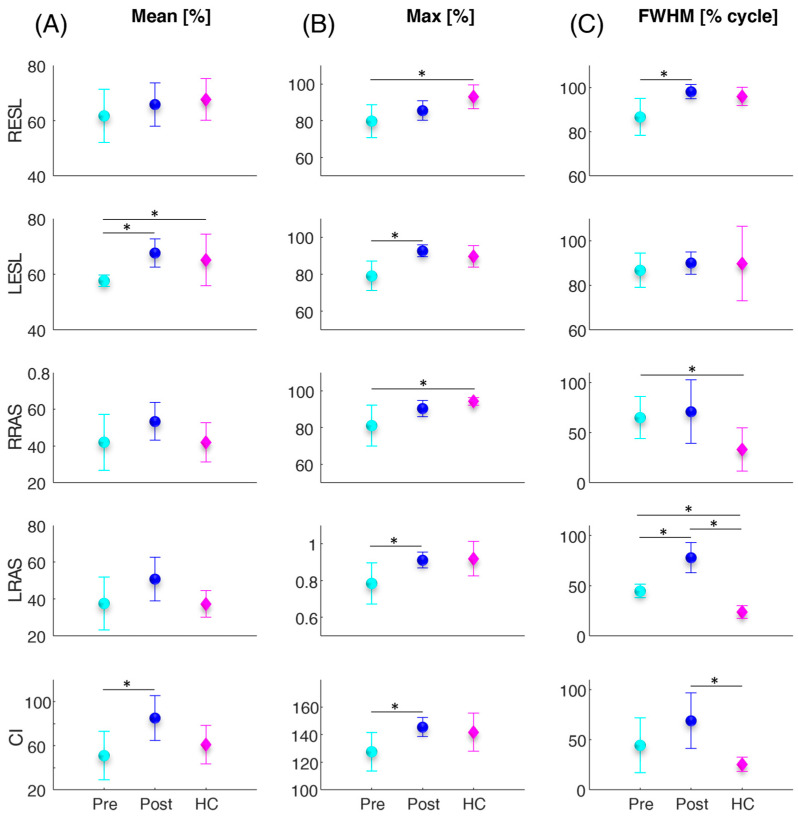
Figure 3.
Average (circles and diamonds) and standard deviation (vertical lines) values over all subjects of the mean (A), maximum (max) (B), and full width at half maximum (FWHM) (C) of the four investigated trunk muscles (RESL, LESL, RRAS, LRAS) and of the co-activation function (CI) for the patients before and after the vertebroplasty surgery (cyan and blue filled circles denoted as Pre and Post, respectively) and for the healthy controls (magenta filled diamonds denoted ad HC) computed during the lifting task. The asterisks (*) indicate significant differences.

