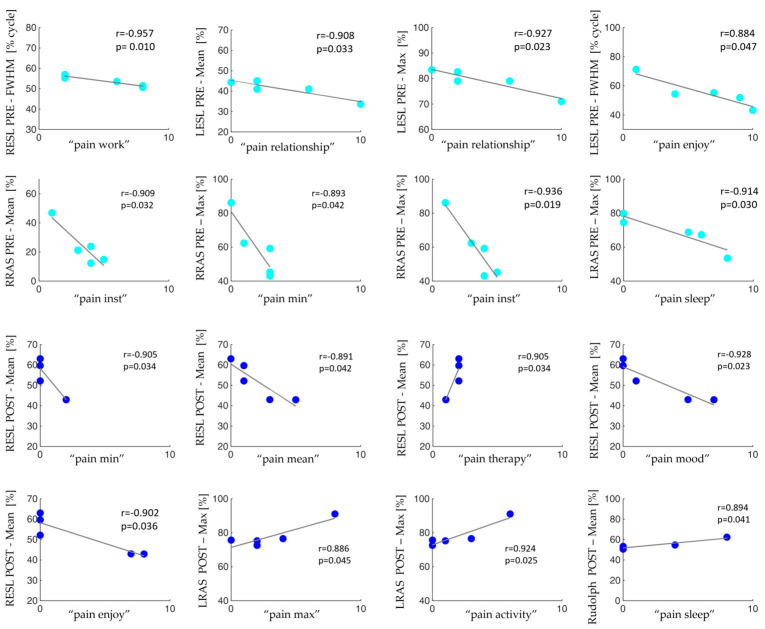
Figure 5.
Data scatter plots and the fit line together with the Pearson’s coefficient (r) and the statistically significant p values between co-activation and trunk muscle parameters and the BPI items in patients with MM before (cyan dots) and after (blue dots) the surgery in the sit-to-stand activity.

