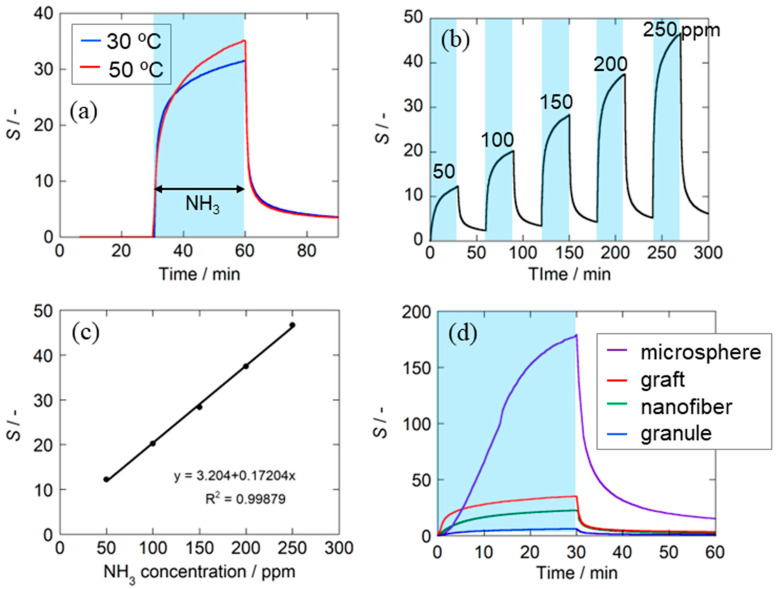
Figure 5.
The characteristics of the PANI graft film sensor: (a) response–recovery curves to 250 ppm of NH3 measured at 30 °C and 50 °C, (b) response–recovery curve to 50–250 ppm NH3 at 50 °C, (c) calibration curve measured at 50 °C, and (d) comparison of response–recovery curves of sensors with different PANI forms.

