Figure 7:

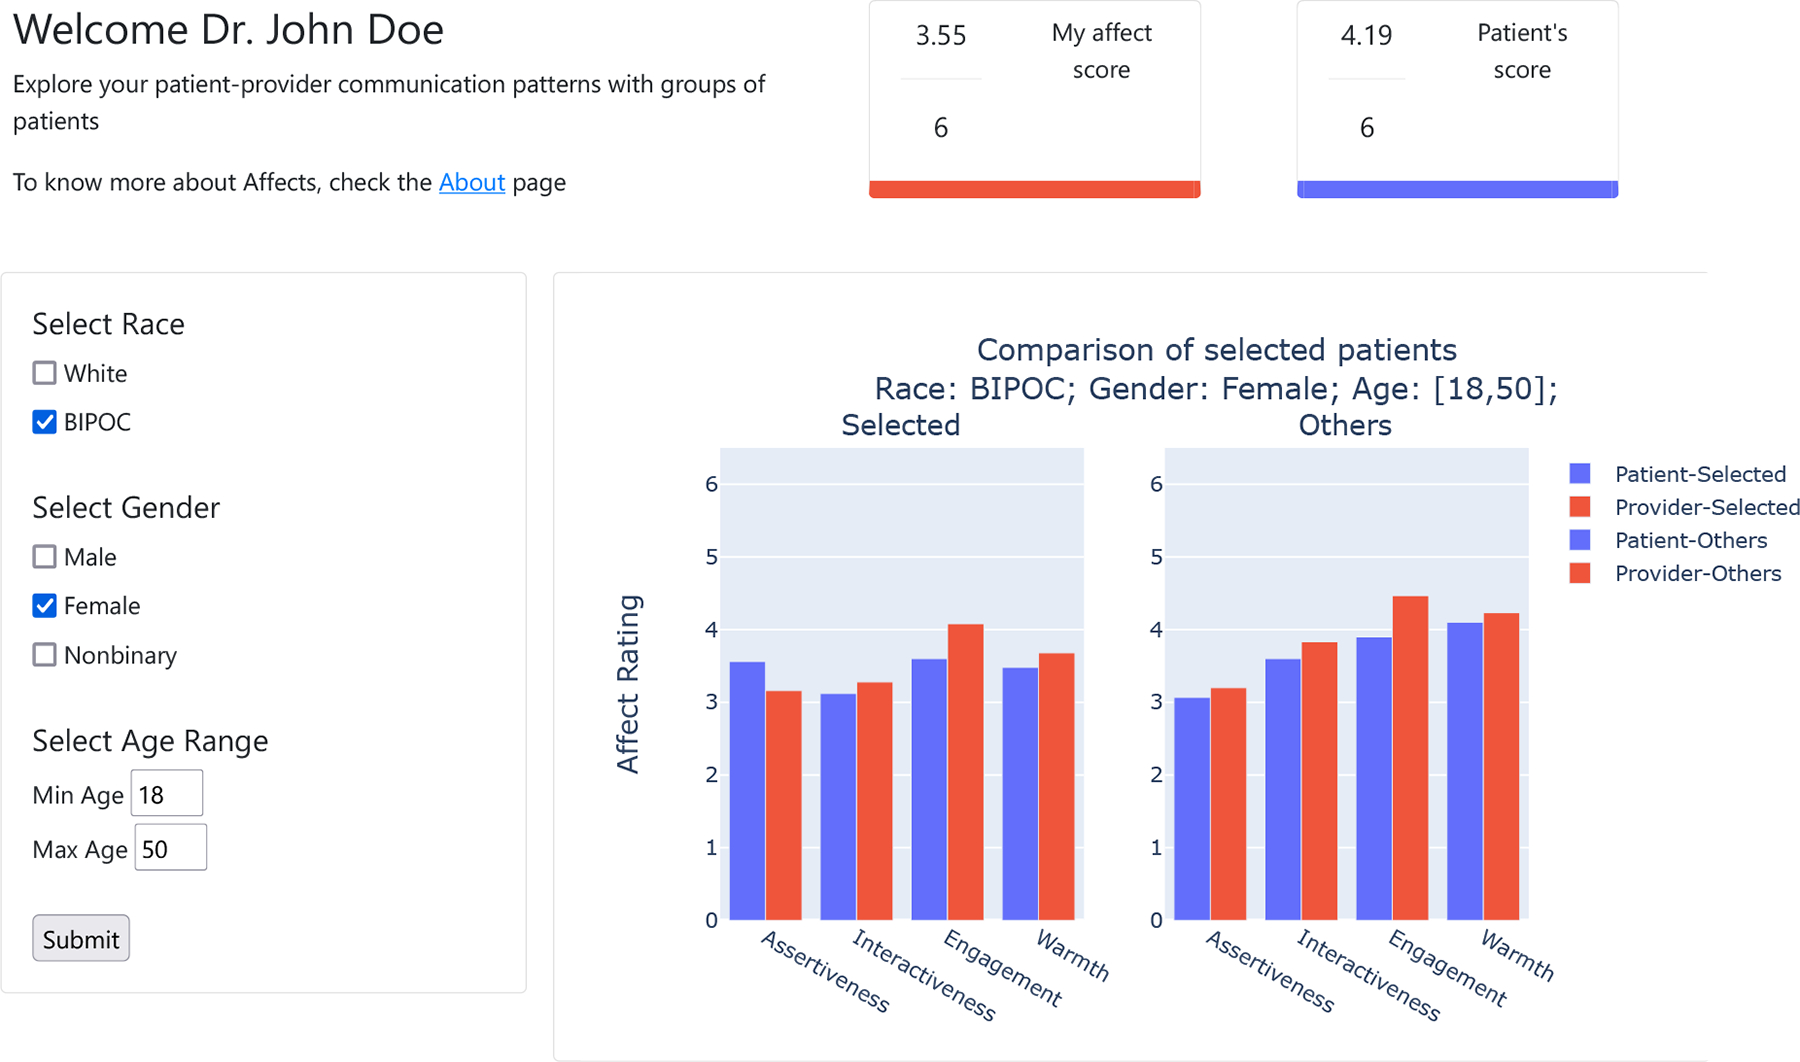
Population view provides different filters to visualize visits with patients from different demographic groups. Users can select filters to visualize the average affect with a selected group compared to other patients

Population view provides different filters to visualize visits with patients from different demographic groups. Users can select filters to visualize the average affect with a selected group compared to other patients