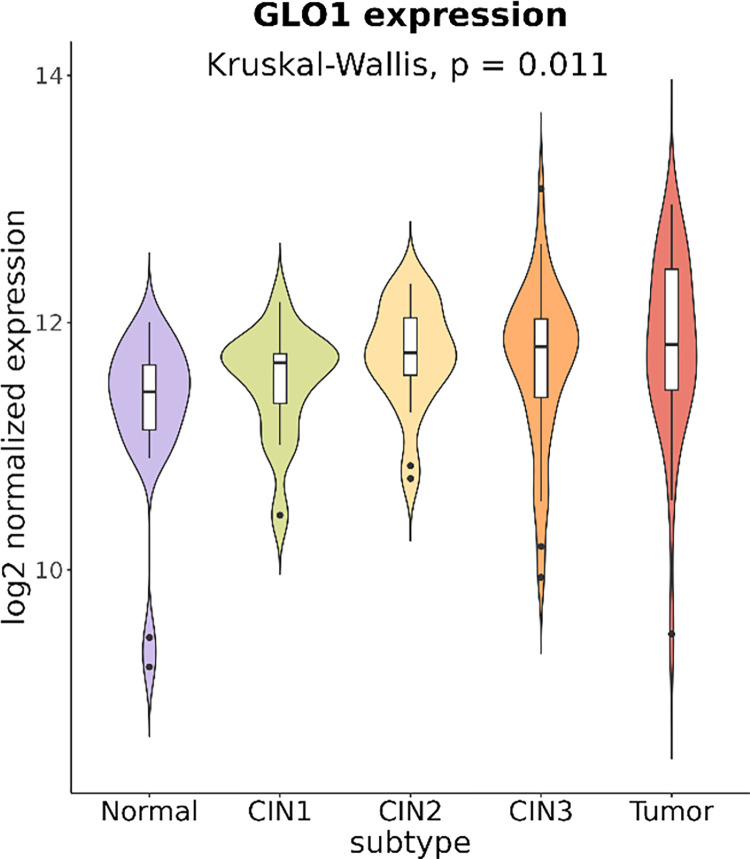
Fig 4. GLO1 expression in normal, cervical intraepithelial neoplasia (CIN1 to CIN3), and cervical cancer tissue samples by microarray analysis.
Microarray data from the GEO database (GSE63514) were downloaded and visualized in the violin plots for 24 normal, 14 CIN1, 22 CIN2, 40 CIN3, and 28 cervical cancer samples. The Kruskal-Wallis test was used for global comparison across 5 subtypes, where the Dunn’s test was used for pairwise comparisons.

