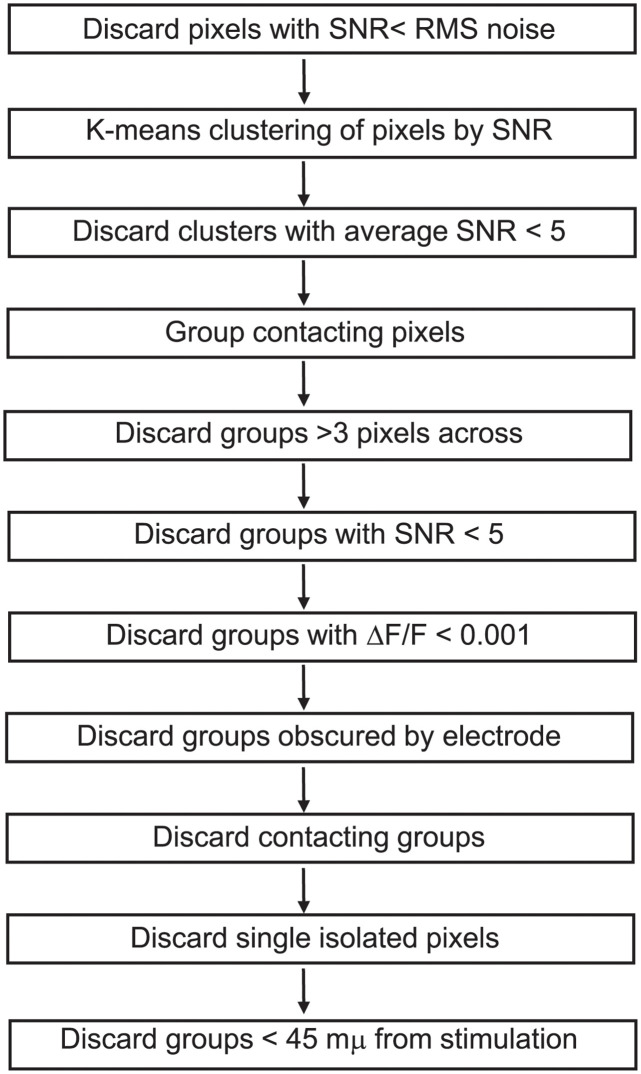
Fig 1. A flowchart illustrates the steps of analysis used to identify responsive neurons in maps of activity (ΔF/F) and signal-to-noise ratio (Fig 2).
The sequence of steps illustrates the multiple criteria employed in identifying ROIs as single PV interneurons for analysis.

