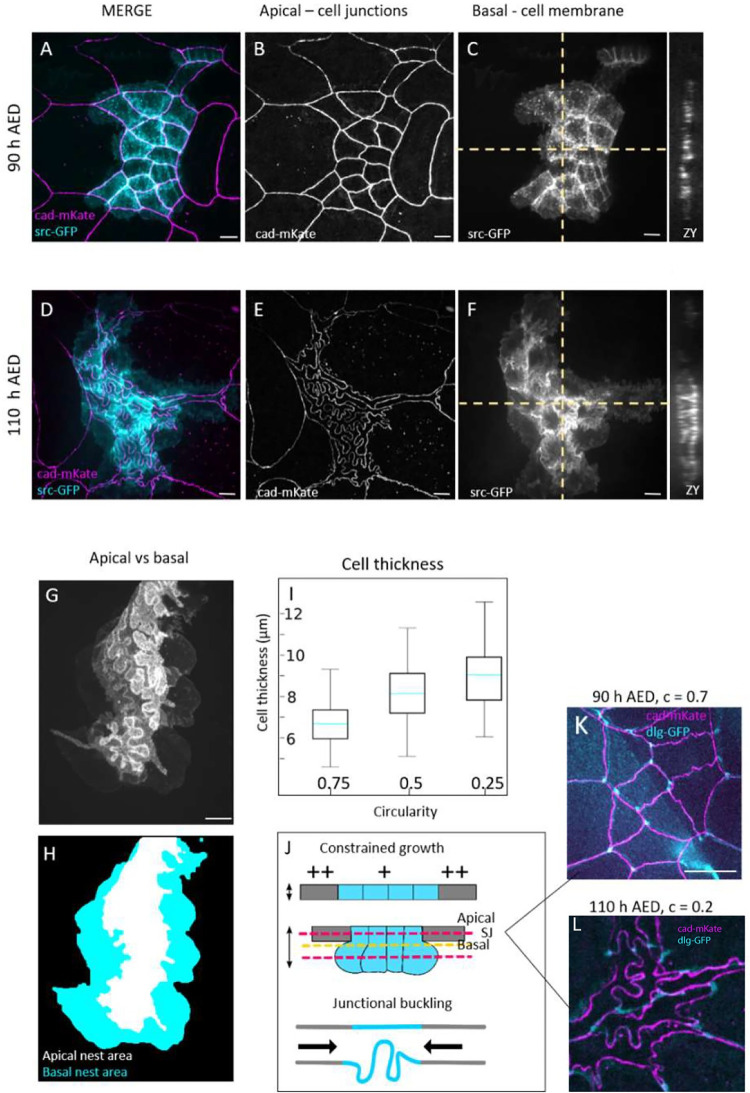
Fig 2. 3D characterization of histoblast growth and junctional buckling.
(A-F) Live imaging of cadherin junctions (E-cad:mKate) and cell membrane (src:GFP) before (A-C) and after (D-F) apical junction remodeling. (G, H) Superposed projections of the apical and basal plane of a histoblast nest at 110 h AEL. While the apical side presents junctional lobules, the basal side is characterized by large and bulb-shaped cells. (I) Cell thickness plot as a function of cell circularity. Light blue line represent the means, error bars the standard deviation. Thirty different nests were analyzed, from 10 larvae. (J) Schematics of cell growth below the apical surface as junction remodeling occurs. At the top, section of histoblast and LECs showing how histoblast develop below the epithelial surface. Red dashed lines represent the apical and largest basal plane corresponding to images A-F. The yellow dashed line represents the plane of septate junctions, corresponding to images K and L. (K, L) Merged projection of apical junctions and septate junctions at 90 h AEL (K) and 110 AEL (L). Before junctional buckling, apical and septate junctions have similar, superimposing structures. When apical junctions fold, the deformation is partially lost at the plane of septate junctions. White dashed circle: example of straight septate junction. Yellow dashed circle: example of septate junction not following the corresponding apical junction. The data underlying the graphs shown in the figure can be found in S1 Data. Scale bar = 10 μm.

