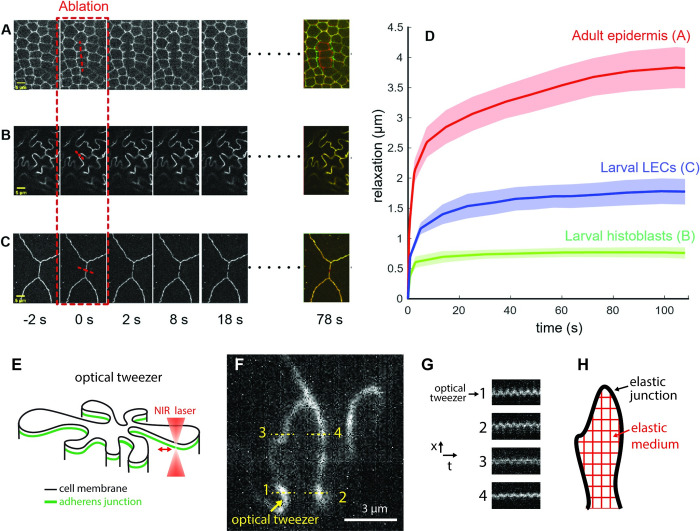
Fig 4. Probing mechanics of histoblasts.
(A) Laser dissection of pupal epidermis. (B) Laser dissection of histoblasts in a 95-h AEL larva. (C) Laser dissection of LECs in a 95-h AEL larva, close to histoblasts. In A, B, and C, the last panel on the right represent the merge of the tissues before and 78 s after ablation. (D) Quantification of relaxation curve for the 3 conditions in A (red), B (green), and C (blue). Each curve is the average of 5 replicates. Error bars represent standard error. (E) Schematic of an optical tweezer experiments. A near-infrared laser is used to mechanically stimulate a junction in a point-wise fashion. (F) Image of a junction where stimulation proceeds at point 1 and displacements are probed at points 1, 2, 3, and 4. (G) Corresponding kymographs. Point 2 displays the strongest oscillation in phase with the stimulus. (H) Observation align with a schematic where different points of the elastic junction are interconnected by an elastic cell medium. The data underlying the graphs shown in the figure can be found in S1 Data.

