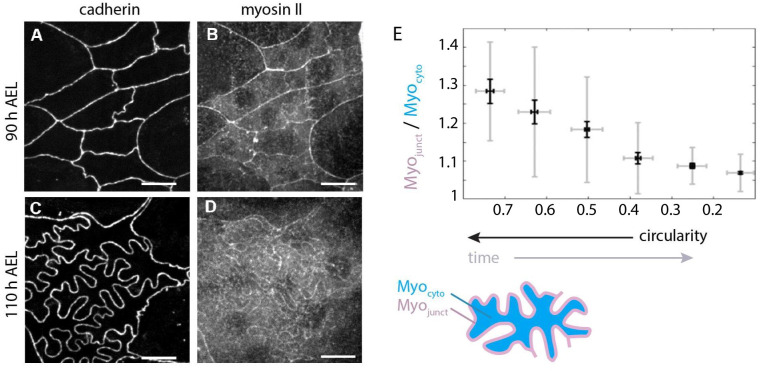
Fig 6. Localization of Myosin II in histoblasts before and after apical junction remodeling.
Live imaging of E-cadherin (E-cad:mKate) and myosin II (MyoII:GFP) in the junctional plane of histoblasts at 90 h AEL (A, B) and 110 h AEL (C, D). Scale bar = 10 μm. (E) Plot of relative amount of junctional myosin as a function of circularity, calculated as the ratio of junctional (Myojunct) over cytosolic (Myocyto) pools, as represeted in the schematic. Note that the axis of circularity has been inversed to reflect temporality. In the box plot, the horizontal bar represents the median for each bean, the shadowed areas the confidence interval of 0.05, the diamonds correspond to the mean value for each bin and the yellow circles are single data points. Pearson’s correlation coefficient calculated on all points is 0.59 with p-value p~10−32. t Test comparisons for the junctional enrichement of the first and last point gives p-values of p~10−33. For each bin, N = 17, 29, 45, 39, 50, 199. A total of 29 histoblast nests with about 15 cells/nest were analyzed. The data underlying the graphs shown in the figure can be found in S1 Data.

