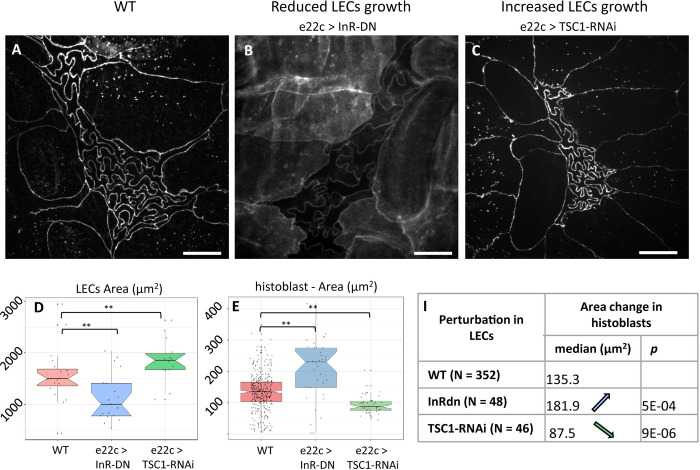
Fig 7. Growth modifications in LECs affects spatial restrictions on histoblast nests.
(A) Live imaging (cad:mKate) of WT Drosophila epidermis (110 h AEL). (B) Live imaging (cad:GFP) of the epidermis (110 h AEL) when LECs growth was reduced through insulin pathway alteration (e22c>UAS-InR-DN, note that the membrane reporter src:GFP was coexpressed with InR-DN). (C) Live imaging (cad:mKate) of larval epidermis after increase of LECs growth through expression of TSC1-RNAi (e22c>TSC1-RNAi). Scale bar = 10 μm. (D, E) Qualification of the apical area of LECs (D) and histoblasts (E) upon the aforementioned alterations of LECs growth. (F) Table of histoblast area changes upon the aforementioned alteration of LECs growth. Further details on statistical analysis can be found in Tables D and E in S1 Text. Average cell number per nest = 16 1 (WT, STD), 16 1 (e22c>InR-DN), 14 22 (e22c>InR-DN). The data underlying the graphs shown in the figure can be found in S1 Data.

