
Figure 3. Advanced endochondral ossification in ninein-deleted mice.
(A) Whole skeleton preparation of E16.0 embryos, stained for mineralized bone using Alizarin red. Left, control heterozygous, right: ninein del/del embryo. Despite an overall similar staining, ossification centers are visible in ninein-deleted embryos in central metacarpal and metatarsal bones (arrows, right images) whereas they are not yet mineralized in controls (FL, forelimb; HL, hindlimb). At E16.5, dual staining for cartilage and bone was performed on whole embryos, and dissected FL and HL are shown in (B) and (C), respectively. In control feet, early signs of mineralization appear in central metacarpal (arrows in B) and metatarsal bones (arrowhead, C). A stronger mineralization is evident in ninein-deleted embryos in both forelimb and hindlimb feet (asterisks in B, C, right panel). Dissection of long bones reveals no size differences between control and ninein-deleted embryos (fe, femur; fi, fibula; h, humerus; r, radius; s, scapula; t, tibia; u, ulna). (D) Pentachrome staining of a tibia epiphysis of a control embryo at E16.5. (E, F) Alkaline phosphatase and alcian blue staining for osteoblasts and cartilage, respectively, revealing no differences in tibiae of control and mutant embryos. (G) Von-Kossa and toluidine-blue-stained section of a control embryo at E18.5. Arrows indicate osteoblasts. (H, I) Measurements of the zone of proliferating chondrocytes (zpc) and of the zone of hypertrophied chondrocytes (zhc), as shown in (D). +/- indicate heterozygous control mice, -/- indicate ninein del/del mice. Eight and ten embryos were used for each genotype at E16.5 and E18.5, respectively. (J) Quantification of the number of osteoblasts per bone length (N.Ob./B.L.), as displayed in (G). Six embryos/genotype were analyzed for each time point Bars, (A) 3 mm, (C) 1 mm, (E, F) 250 μm and (G) 150 μm.
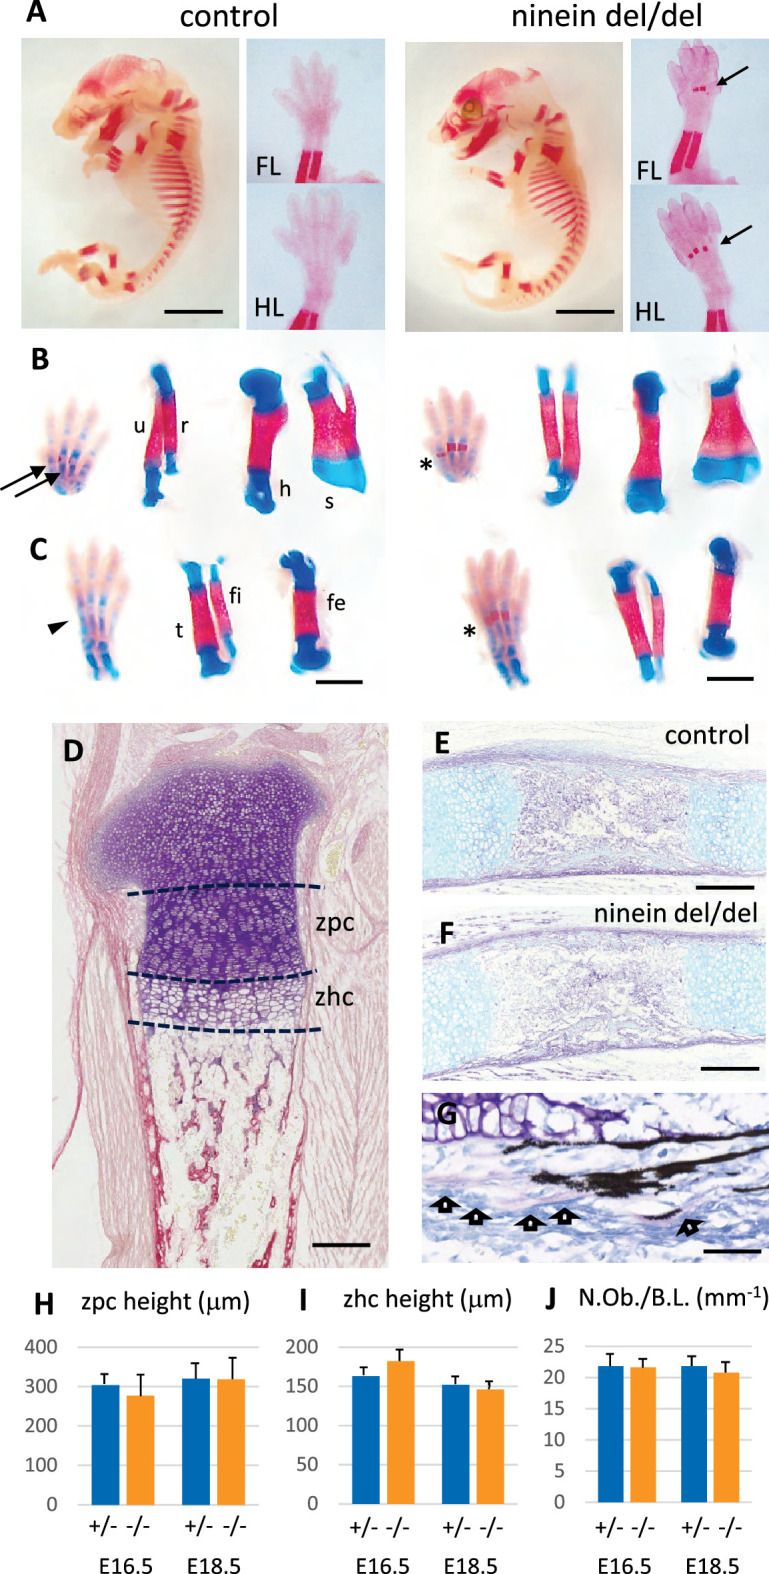
Figure 3—figure supplement 1. Early endochondral ossification is present at multiple sites of bone formation.
