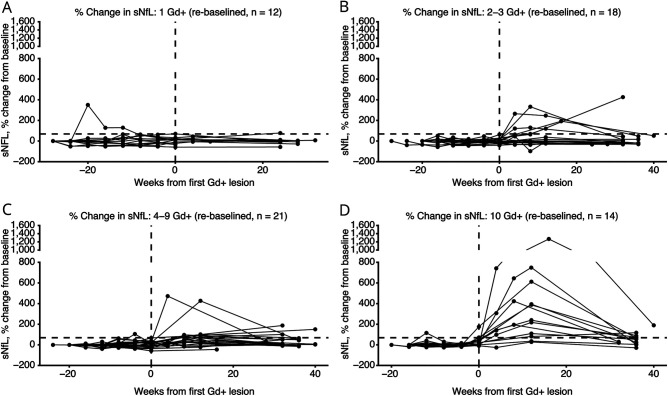
Figure 2. Timecourse of Changes in sNfL Levels According to Number of Gd+ Lesions.
Proportional change in individual subject sNfL levels over time according to the number of Gd+ lesions observed in each subject. Vertical dotted line represents time of first detected Gd+ lesion; horizontal dotted line represents the 68.8% change in sNfL from baseline. Gd+ = gadolinium-enhancing; sNfL = serum neurofilament light chain.

