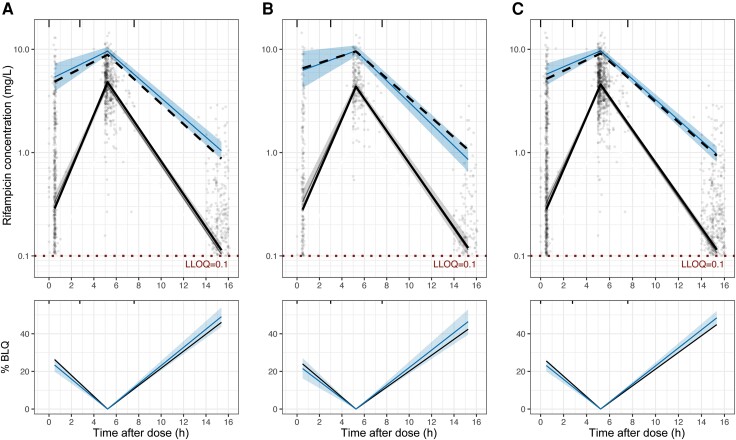
Figure 2.
Visual predictive check of the final population PK model in the analysis cohort (A), validation cohort (B), and full cohort (C). In the top panels, model predictions (gray-shaded area [median] and blue-shaded area [95th percentile]) are shown overlaid with observations (solid black line [median] and dashed black line [95th percentile]) with LLOQ at 0.1 mg/L. Dots represent individual observed rifampicin concentrations. In the bottom panels, model-predicted median percentages of samples BLQ (blue shaded area) are shown overlaid with observations (black solid line). The following bins were used to calculate the summary statistics: 0.5–3, 3–8, and 8–20 hours. The observed fifth-percentile data were removed due to high percentages of BLQ at 0.5 and 15.5 hours after dose. Abbreviations: BLQ, below the limit of quantification; LLOQ, lower limit of quantification; PK, pharmacokinetics.

