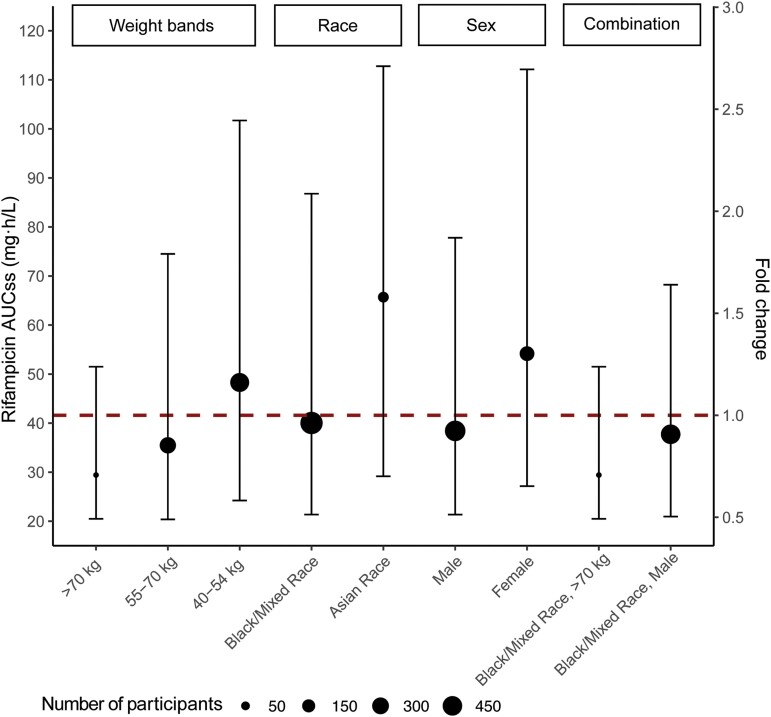
Figure 3.
Model-derived rifampicin exposure stratified by significant covariates (body weight, sex, and race). Dots and bars represent stratified medians and ranges (5th to 95th percentiles) for each subpopulation. The size of dots shown corresponds to the number of participants. The dashed horizontal line corresponds to median exposure of entire population or fold change of 1 (41.8 mg·h/L). Abbreviation: AUCss, area under the plasma concentration-time curve at steady state.

