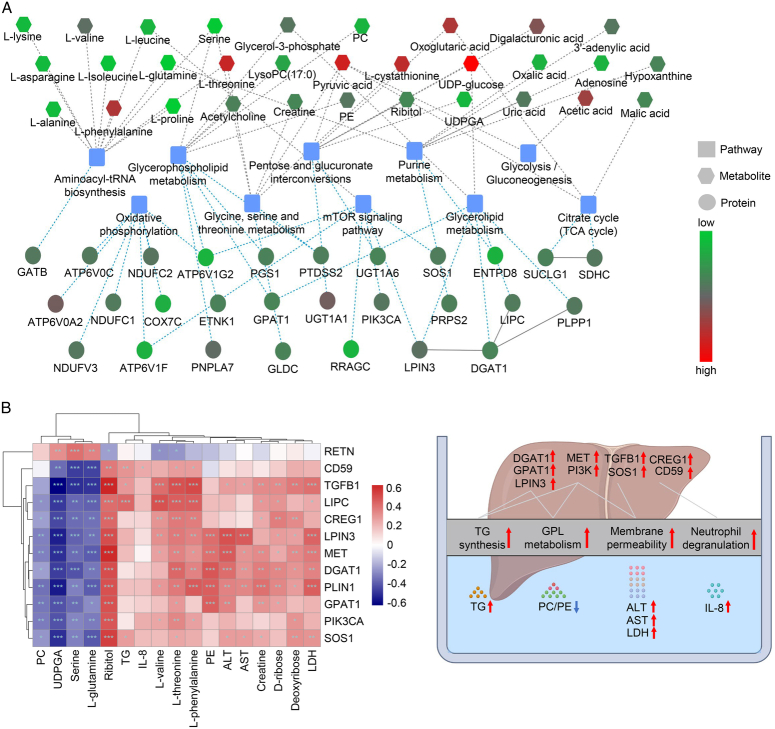
Figure 4.
Integrative analysis of graft proteomics and perfusate metabolomics. (A) The network showed the interaction of differentially abundant proteins and metabolites and the related metabolic pathways. (B) The correlation plot between the TOP DEMs and DEPs (***P<0.001; **P<0.01; *P<0.05). (C) The key graft proteins and perfusate metabolic products reflected the graft status, including TG and GPL metabolism, cellular membrane permeability, and neutrophil degranulation, which were associated with EAD. ALT, alanine transferase; AST, aspartate transferase; EAD, early allograft dysfunction; FC, fold change; GPL, glycerophospholipid; IL-8, interleukin-8; LDH, lactate dehydrogenase; PC, phosphatidylcholine; PE, phosphorylethanolamine; TG, triglyceride; UDPGA, UDP glucuronic acid.

