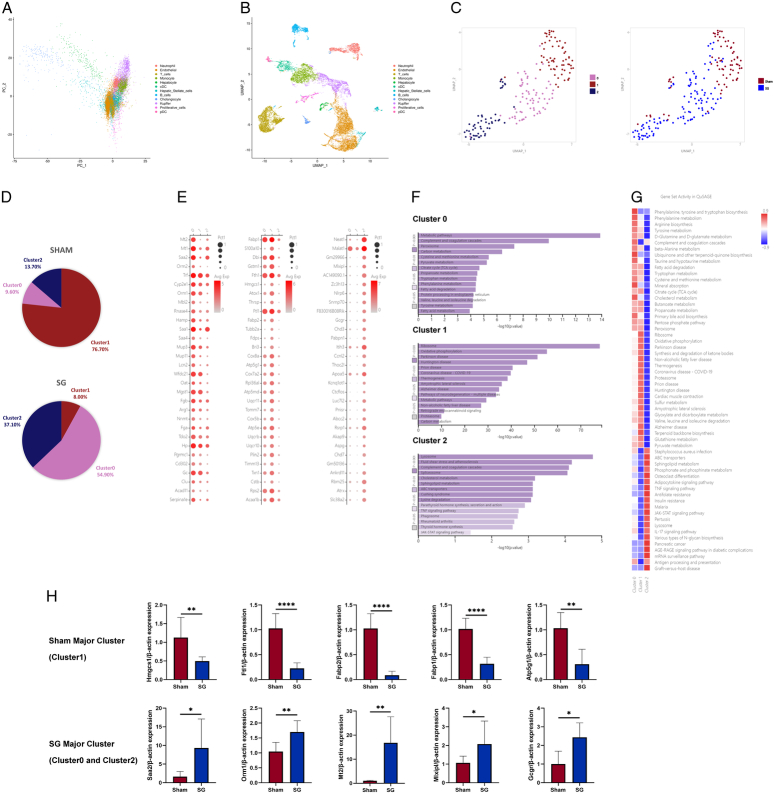
Figure 5.
Single-cell transcriptomics reveals changes in liver cell populations after SG. (A) PCA analysis was not suitable for analyzing scRNA-seq data, so (B) the UMAP algorithm was chosen for dimensionality reduction, dividing liver cells into 12 cell clusters and (C) re-clustering liver cell populations to obtain 3 subclusters, with (D) significant differences in the distribution of 3 subclusters between the SG and Sham groups. (E) The functions of each subcluster were defined based on the dominant expressed genes. (F) Pathway analysis of the 3 subclusters showed that the metabolic ability of Cluster 0 was significantly different, Cluster 1 was closely related to NAFLD, and Cluster 2 had obvious regeneration signals. (G) The QuSAGE analysis was consistent with the above conclusion. (H) The qRT-PCR results of isolated postoperative mouse hepatocytes validate the expression changes in different hepatocyte subclusters indicated by scRNA-seq. (Data are shown as mean±SE. *=P<0.05, **=P<0.01, and ****=P<0.0001. For panel H, n=8 Sham, 8 SG). NAFLD, non-alcoholic fatty liver disease; PCA, principal component analysis; SG, sleeve gastrectomy.

