Figure 6.
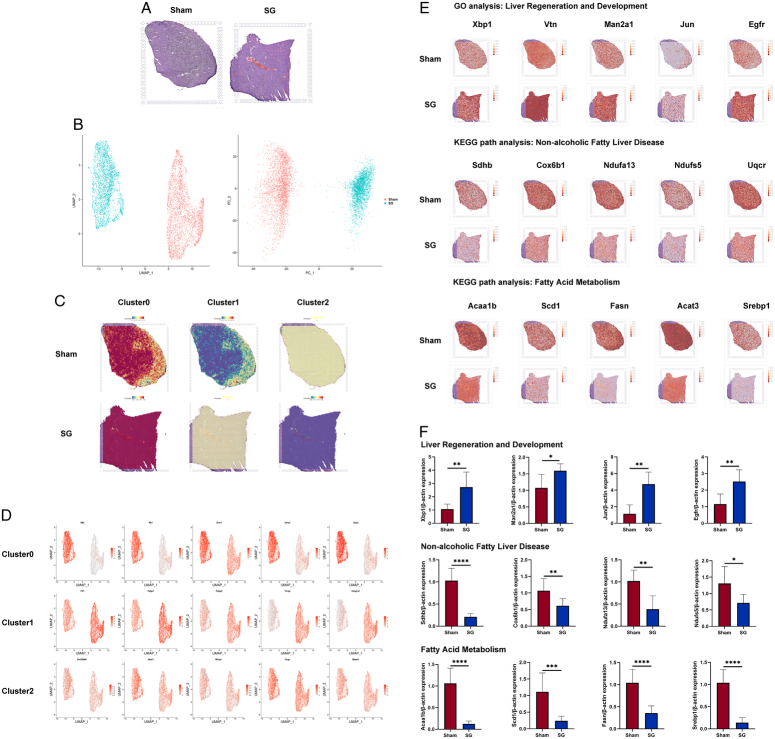
Spatial transcriptomics unveils extensive changes in hepatocyte expression induced by SG. (A) The H&E staining results of the liver samples used in ST were used to provide spatial location information. (B) Both PCA analysis and UMAP dimensionality reduction analysis showed significant differences between the two groups of liver spots. (C) Marker genes for re-clusters in scRNA-seq were used to stain the ST spots, and the results were consistent with the distribution of the above re-clusters results. (D) However, since each spot often contains multiple cells, it caused a certain degree of specificity reduction, so the functional representative genes of the 3 subclusters were extracted and stained on the ST results. (E) Meanwhile, genes related to liver regeneration and development, NAFLD, and fatty acid metabolism pathways in scRNA-seq were extracted and stained on ST results, showing that the liver regeneration and fatty acid metabolism abilities were significantly enhanced after SG, and there were significant differences in the spatial distribution of NAFLD-related cells between the SG and Sham groups in the liver. (F) The qRT-PCR results of isolated postoperative mouse hepatocytes validate the pathway analysis results of GO and KEGG provided by ST. (Data are shown as mean±SE. *=P<0.05, **=P<0.01, ***=P<0.001, and ****=P<0.0001. For panel F, n=8 Sham, 8 SG). NAFLD, non-alcoholic fatty liver disease; PCA, principal component analysis; SG, sleeve gastrectomy; ST spatial transcriptomics

