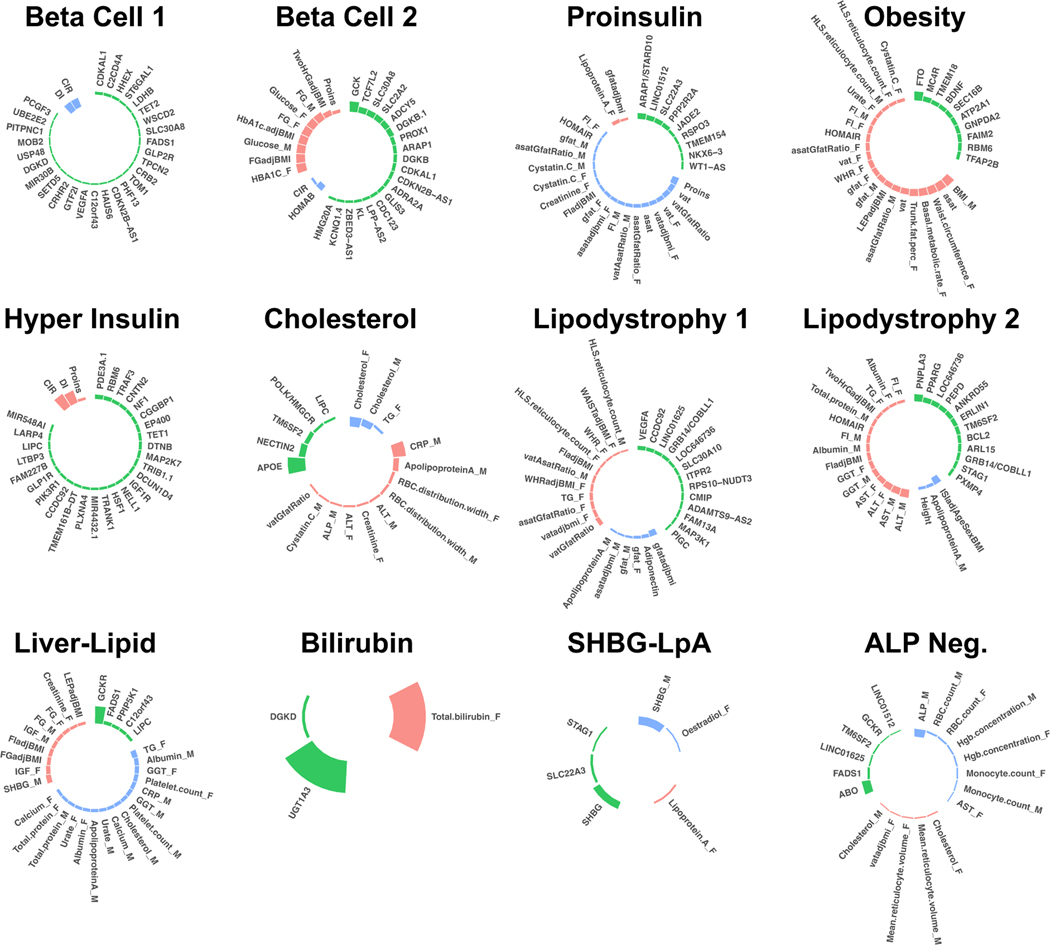
Fig. 1. Key loci and traits of multi-ancestry T2D genetic clusters.
Each plot displays the top-weighted loci and traits within each multi-ancestry T2D genetic cluster. The length of the bars corresponds to the cluster weight determined by the bNMF algorithm. Green bars represent genetic loci, red bars represent traits with increased values, and blue bars represent traits with decreased values within each cluster. Female- and male-specific traits are appended with “_F” and “_M”, respectively. A maximum of 30 elements (loci and traits) with the highest weights are displayed in each cluster. A legend for all abbreviations is included in Supplementary Table 3.

