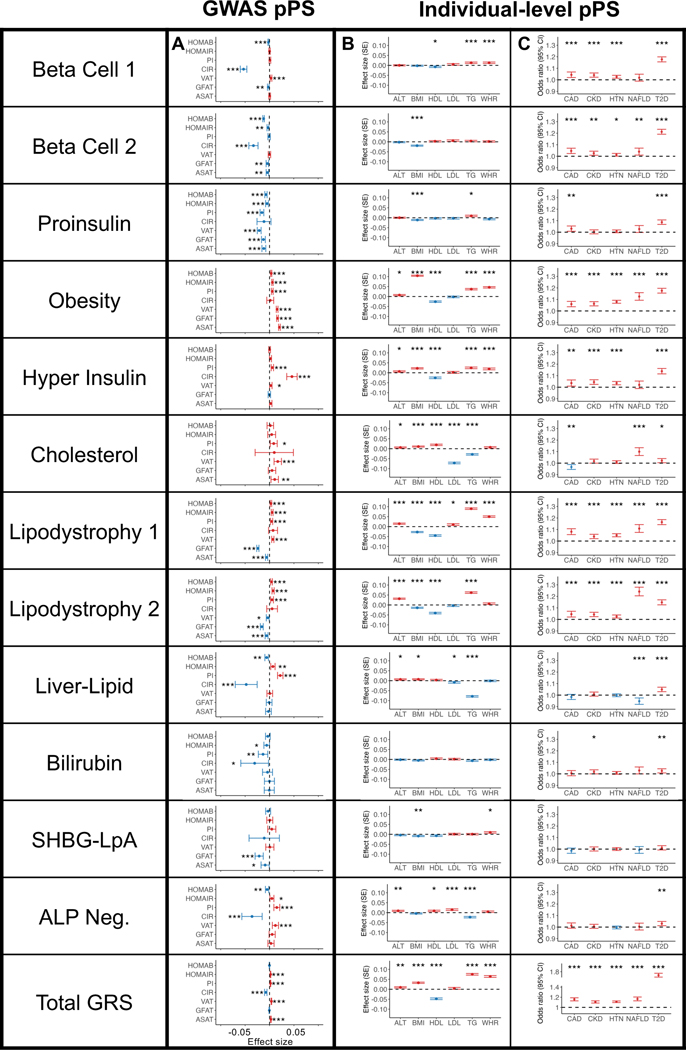
Fig. 2. Multi-ancestry T2D genetic cluster associations with continuous traits and clinical phenotypes.
(A) Each plot displays associations between selected multi-ancestry T2D genetic clusters and selected continuous outcomes, based on GWAS-partitioned pPS. Each dot indicates the beta coefficient from a meta-analysis of GWAS summary statistics. Error bars represent the 95% confidence interval. PI, proinsulin; CIR, corrected insulin response; VAT, visceral adipose tissue; GFAT, gluteofemoral adipose tissue; ASAT, abdominal subcutaneous adipose tissue.
(B) Each plot displays cluster associations with selected continuous outcomes, based on individual-level pPS obtained from a meta-analysis of MGB Biobank and All of Us. Each outcome was normalized to a standard normal distribution. Each dot indicates the effect per one standard deviation increase in the pPS. Error bars represent the standard error from a linear regression model.
(C) Each plot displays cluster-specific odds ratios of selected clinical phenotypes, based on individual-level pPS obtained from a meta-analysis of MGB Biobank and All of Us. Each dot represents the odds ratios per one standard deviation increase in the pPS. Error bars represent the 95% confidence interval.
For all components, positive associations are colored in red and negative associations are colored in blue. P values were obtained from two-sided t tests and are indicated with asterisks (* P < 0.05, ** P < 0.01, *** P < 0.001). A legend for all abbreviations is included in Supplementary Table 3. Complete statistics (including exact P values and the number of individuals measured for each phenotype) are provided in Supplementary Table 10 (Panel A), Supplementary Table 12 (Panel B), and Supplementary Table 15 (Panel C).

