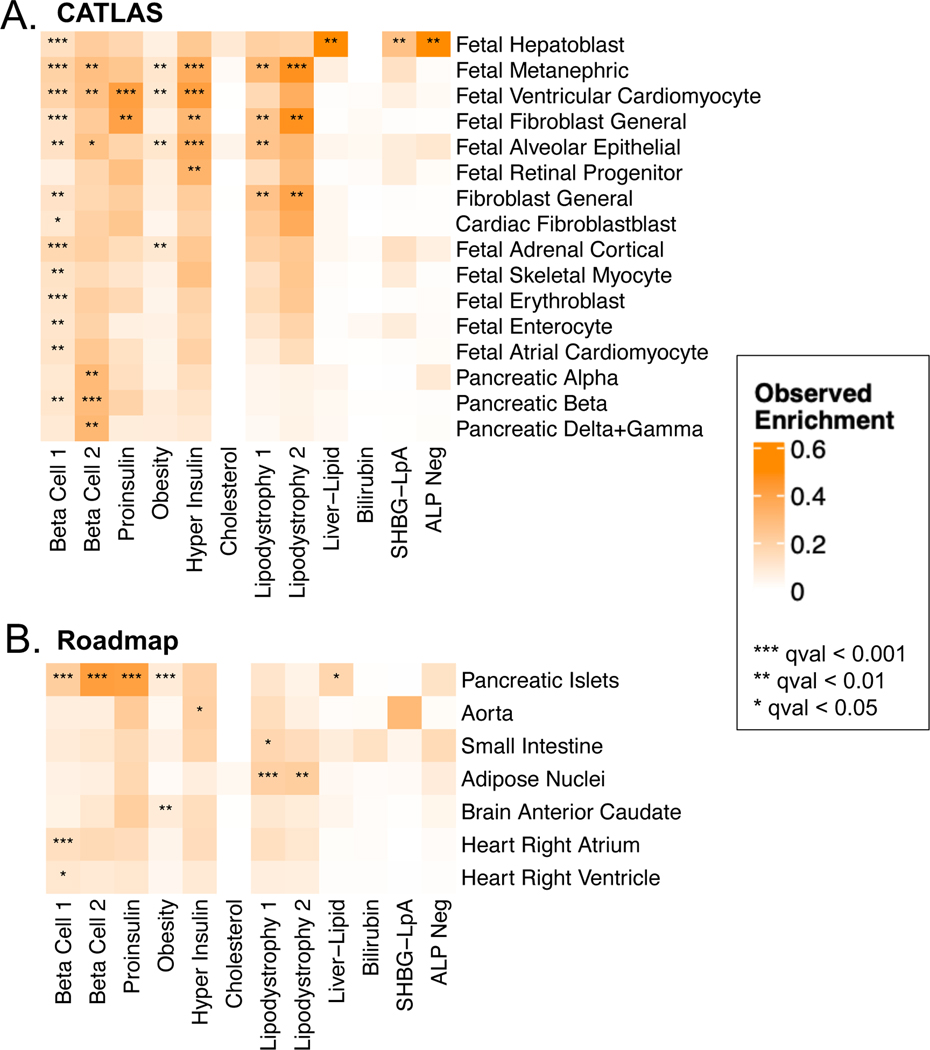
Fig. 3. Enrichment for cell type specific enhancers in multi-ancestry type 2 diabetes clusters.
Heatmaps display the significant cluster-specific enrichment of genomic annotations, represented by cumulative posterior probability, in (A) CATLAS single cell accessible chromatin data from 222 cell types and (B) Epigenomic Roadmap chromatin state calls from 28 cell types. Q values were corrected for false discovery rate (FDR). For both analyses, only cell types with at least one association of FDR < 0.1 are included in the figure, with additional data in Supplementary Table 17.

