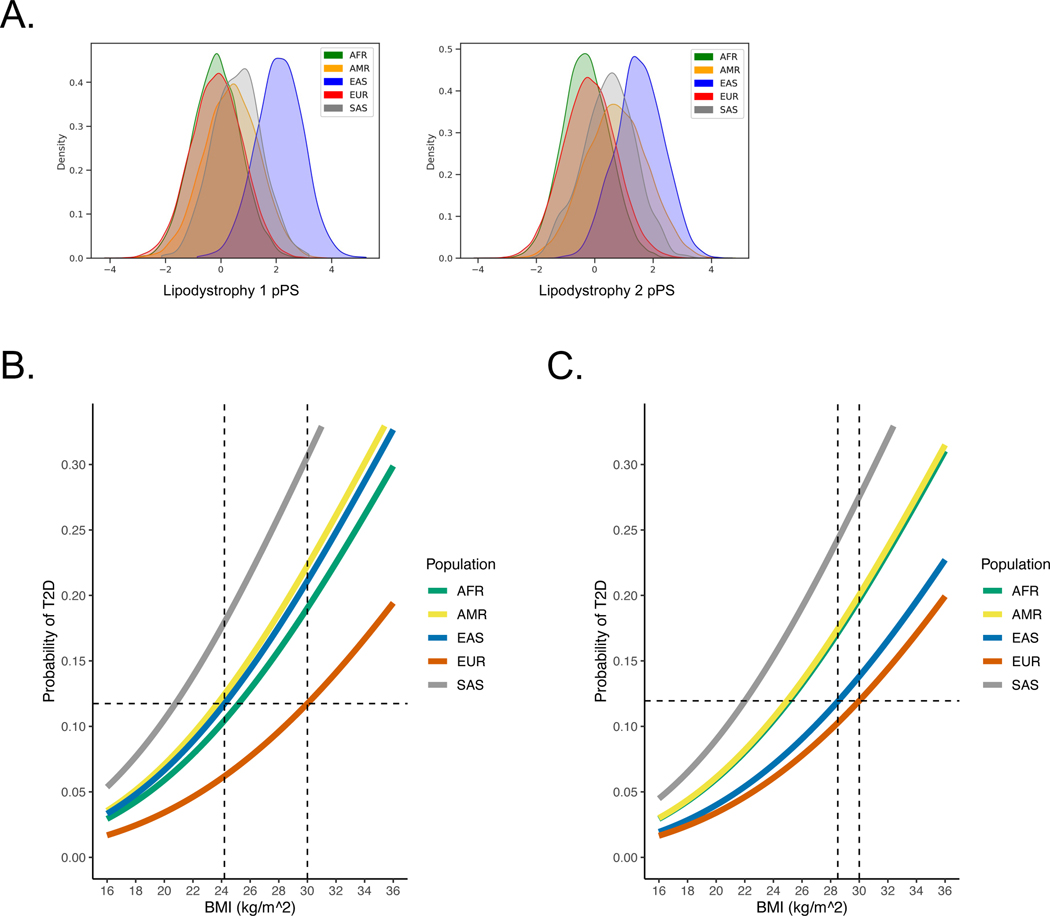
Fig. 4. Ancestry-specific relationship between T2D genetic clusters, BMI, and T2D risk.
(A) Ancestry-specific distribution of Lipodystrophy 1 and Lipodystrophy 2 pPS (normalized to a standard normal distribution).
(B) Relationship between BMI and T2D risk (unadjusted), classified by genetic ancestry. T2D risk was assessed in a logistic regression model, controlling for age, sex, BMI, and genetic ancestry group. The horizontal dashed line represents the T2D risk for participants with European genetic ancestry and a BMI of 30 kg/m2 (typically used to define obesity). The vertical dashed lines indicate the BMI thresholds needed to develop an equivalent risk of T2D in the European and East Asian ancestry groups.
(C) Relationship between BMI and T2D risk, adjusted for Lipodystrophy 1 pPS and Lipodystrophy 2 pPS.
All analyses were performed in a meta-analysis of MGB Biobank and All of Us.

