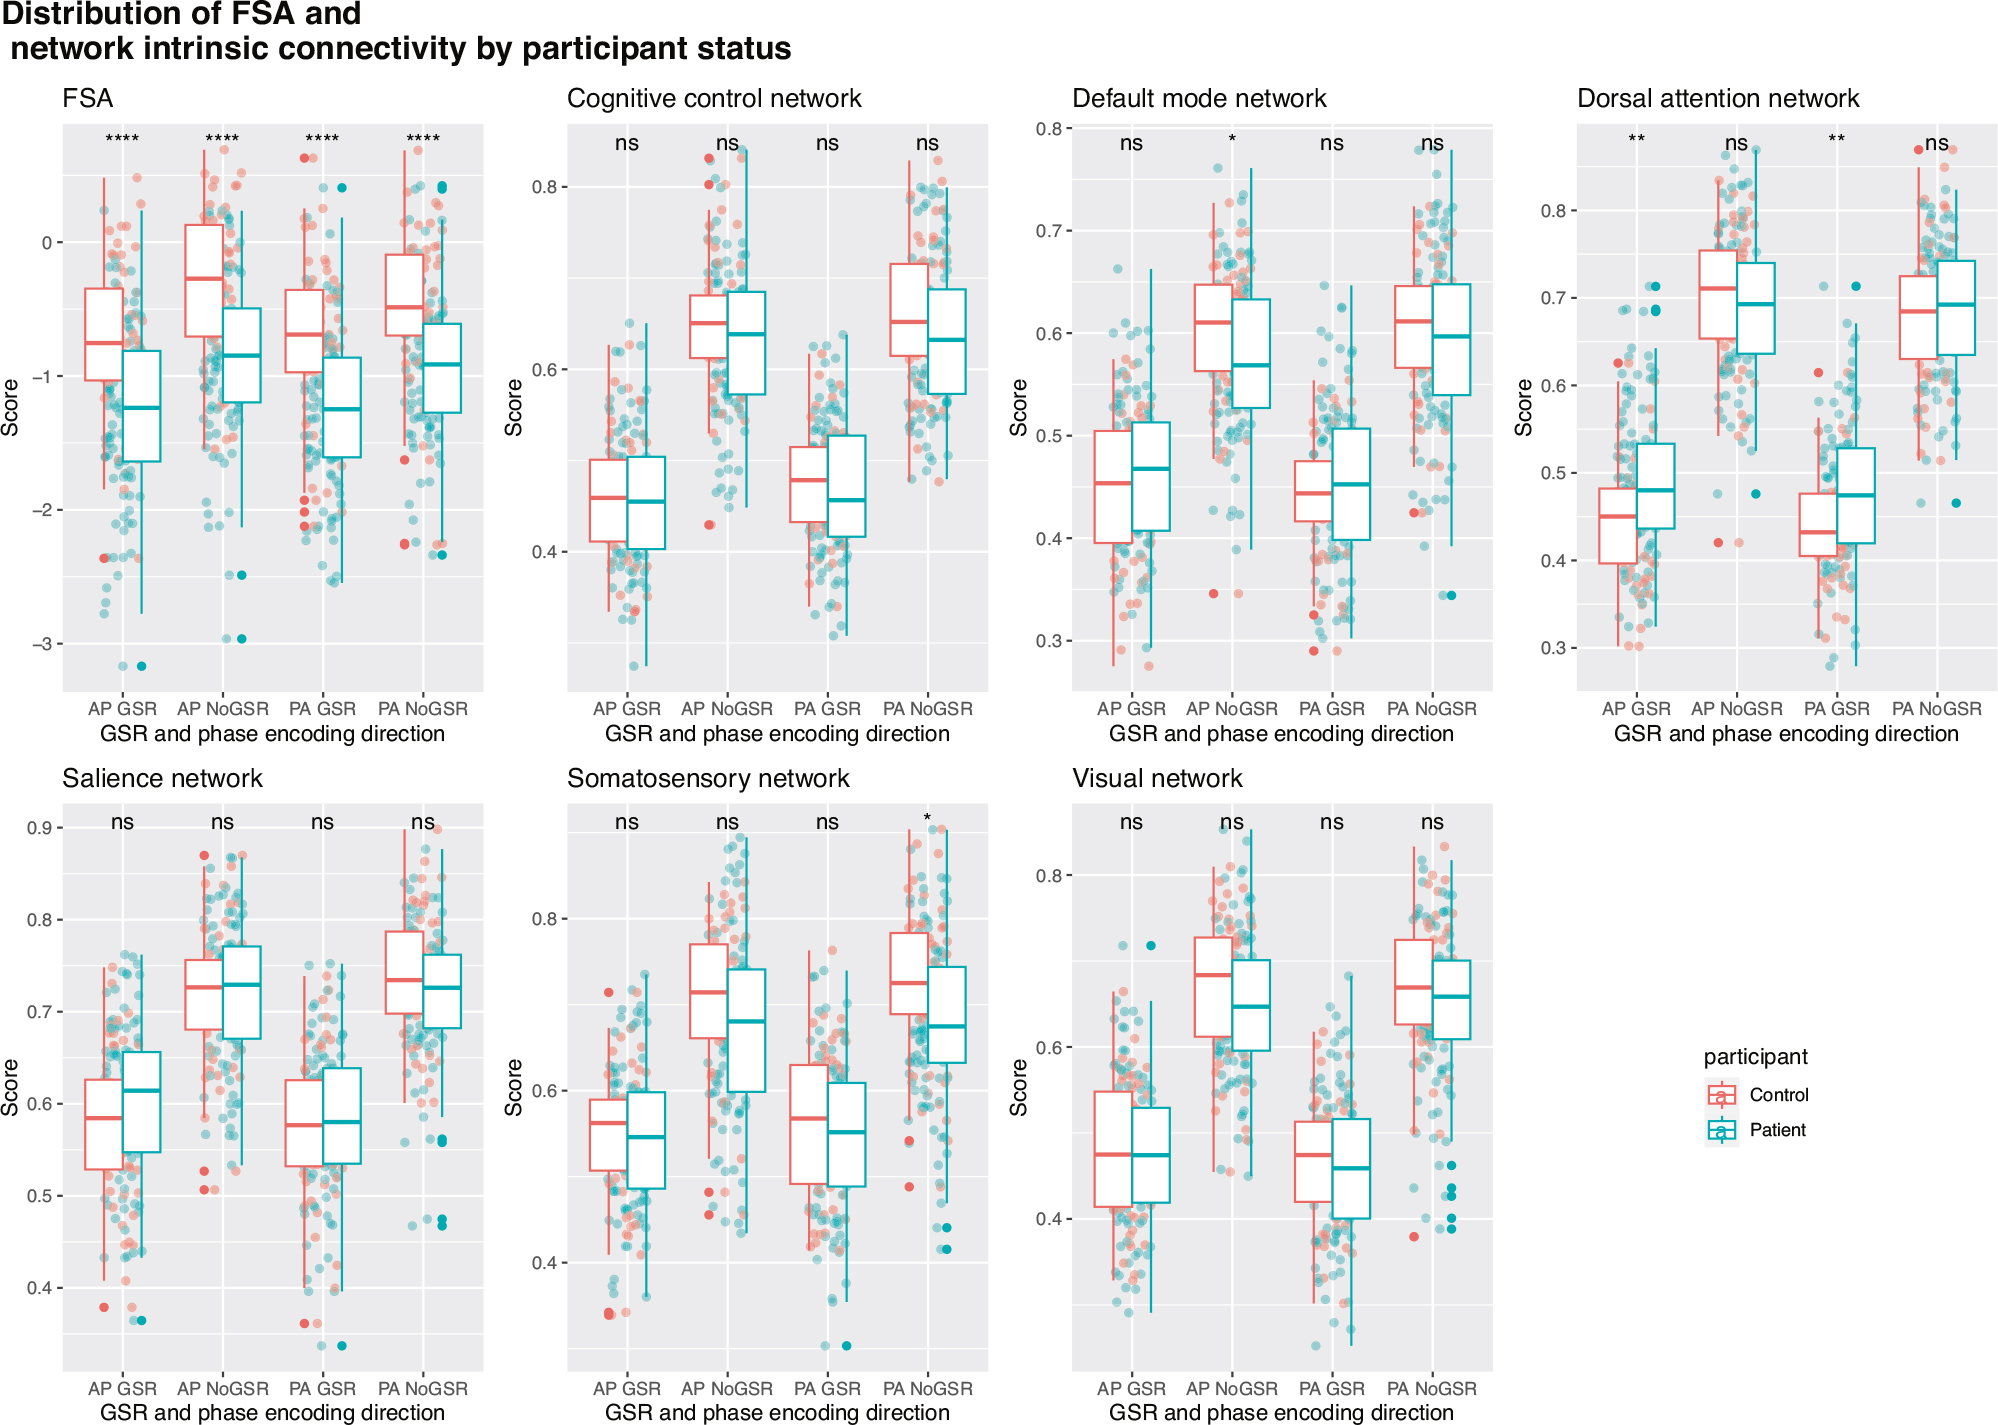
Fig. 2. Distribution of FSA and network intrinsic connectivity values between patients and controls.

Distribution of FSA and intrinsic network connectivity values derived from scans in both phase encoding directions (posterior to anterior and anterior to posterior) with and without global signal regression by participant group (patients vs controls). AP Anterior to posterior, FSA Functional Striatal Abnormality score, GSR Global signal regression, NoGSR No global signal regression, ns non-significant, PA Posterior to anterior; ****p value < 0.0001.
