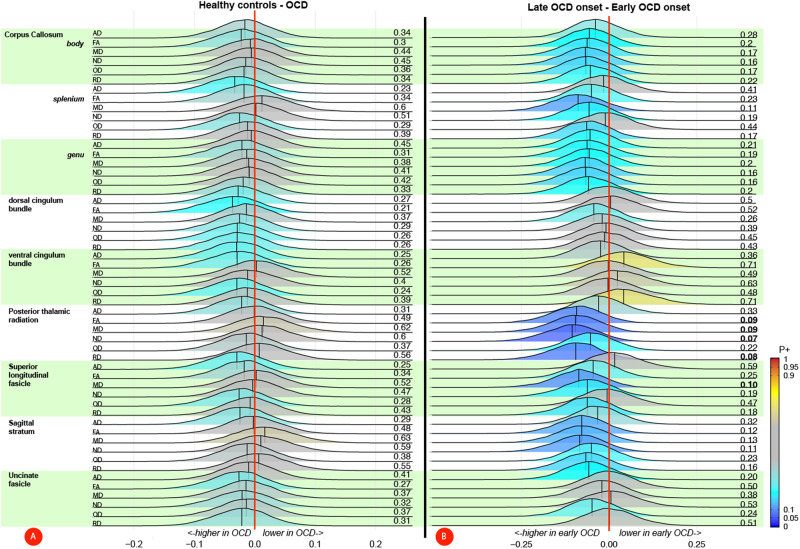
Fig. 1. Bayesian posterior distribution plots of the differences in white matter microstructure between (a) OCD patients and healthy controls and (b) early and late onset OCD patients.
The posterior distribution communicates the credibility of an effect. Posterior probabilities of a positive effect (P + ) are shown next to each distribution and color coded. P+ values ≥ 0.90 (moderate to very high credibility for a positive effect) or ≤0.10 (moderate to very high credibility for a negative effect) are presented in bold. The meaning of the direction of effects are shown next to the red zero-effect line. Values on the X-axis represent (inverted) Z-scores (i.e., the unit to which the tensor/NODDI measures were converted; see methods section). A There was no credible evidence for differences between OCD patients and healthy controls (all 0.10 < P + < 0.90). B P+ values were ≤ 0.10 for several tensor/NODDI measures of the posterior thalamic radiation and superior longitudinal fascicle, signifying moderate to high credibility for a higher value in early onset OCD patients. abbreviations: AD: axial diffusivity, FA: fractional anisotropy, MD mean diffusivity, ND neurite density, OD orientation dispersion, RD radial diffusivity, NODDI Neurite orientation dispersion and density imaging. Plots were produced using the Region-Based Analysis program through Bayesian Multilevel Modeling implemented in AFNI (Chen et al. 2019).

