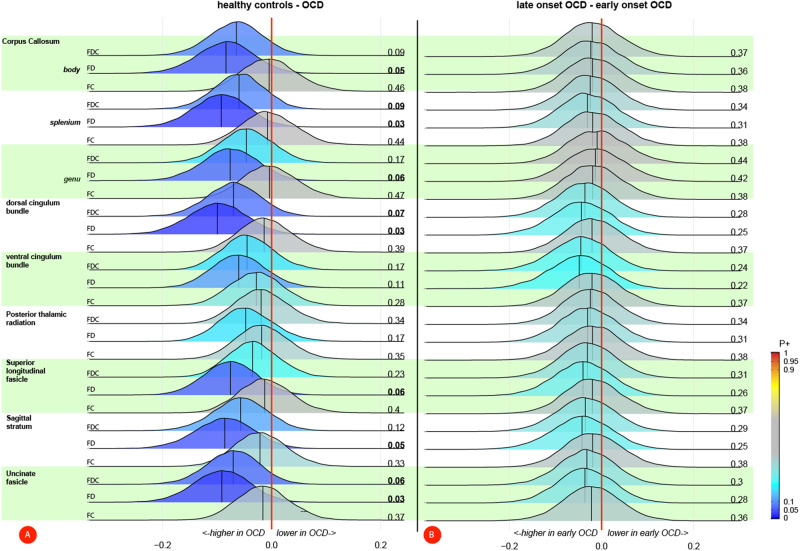
Fig. 2. Bayesian posterior distribution plots on fixel-based measures between (a) OCD patients and healthy controls and (b) early and late onset OCD patients.
A The posterior distributions showed credible evidence for a higher FD (and to a lesser extent FDC) in individuals with OCD compared with healthy controls in the majority of the tracts. There was no credible evidence for a difference in FC. B Credibility for a difference in fixel-based measures between early and late onset OCD patients was low. Posterior probabilities of a positive effect (P+) are shown next to each distribution and color-coded. P+ values ≥ 0.90 (moderate to very high credibility for a positive effect) or ≤0.10 (moderate to very high credibility for a negative effect) are presented in bold. FDC fiber density and cross-section, FD fiber density, FC fiber cross-section.

