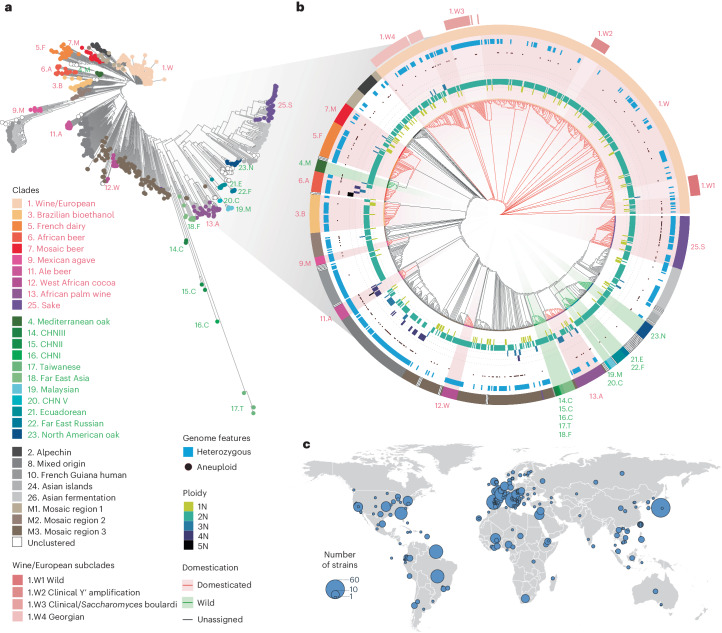
Fig. 1. Origin and genomic diversity of 969 isolates.
a, Neighbor-joining tree based on biallelic SNPs among 969 isolates included in our data. Previously defined subpopulations20 are color-coded. b, Detailed descriptions of several genomic features of the isolates. Circular cladogram for the 969 isolates; the colored branches correspond to domesticated (red) and wild (green) clusters; the ploidy levels for each isolate ranged from 1N to 5N; the presence of any aneuploidy is indicated by a black dot; heterozygosity is shown as a blue bar; clades and subclades are color-coded. c, Geographical distribution of the 969 isolates. The size of the circles indicates the number of isolates included from a given geographical location. The outline of the map was generated using the open-source R package ‘maps’ (v.3.4.2).

