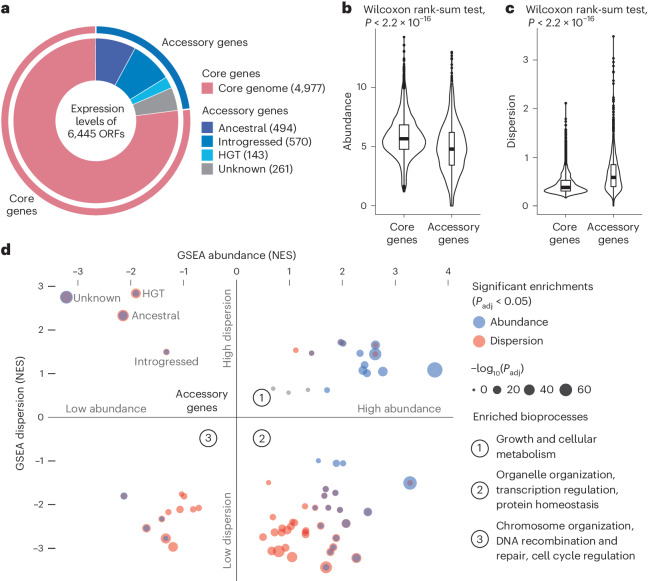
Fig. 2. Functional description of the dataset.
a, Number and distribution of all transcripts analyzed in the data, including 4,977 core genes and 1,468 accessory genes as previously annotated based on their genomes20. b,c, Global comparison of mean gene expression abundance (b) and dispersion (c) between core and accessory genes. Mean expression abundance was calculated as the mean log2 of the normalized read counts (transcripts per million (TPM)) across isolates for which the gene was present in their genome. For gene dispersion, we used mean absolute deviation (MAD), which is more robust to outliers and does not assume normality of expression levels compared with the s.d. For accessory genes, isolates that did not carry the given gene were excluded from the calculations. A two-sided Wilcoxon signed-rank test was performed on 4,977 core genes versus 1,468 accessory genes. The middle bar of the box plots corresponds to the median; the upper and lower bounds correspond to the third and first quartiles, respectively. The whiskers correspond to the upper and lower bounds 1.5 times the interquartile range (IQR) (Supplementary Fig. 3). d, GSEA results for expression abundance (y axis) and dispersion (x axis), presented as normalized enrichment scores (NES). Sixty-two non-redundant GO Slim biological process terms and four accessory gene subcategories were included. Significant enrichments are shown in blue (for abundance) and red (for dispersion). The summary terms for each quadrant are as indicated on the plot. Detailed distributions and enrichments for each term are presented in Supplementary Fig. 4.

